Filing Flows › Health Care › 3M (MMM)
3M (MMM) earnings and revenue breakdown
Latest: Q3 2026 · 10-Q filed Oct 20, 2026 · 3M (MMM) Q3 2026 earnings results →
Q3 2026 Revenue up 1% year over year to $6.6B · 21¢ of every $1 of revenue kept as net profit · operating margin 23.7%
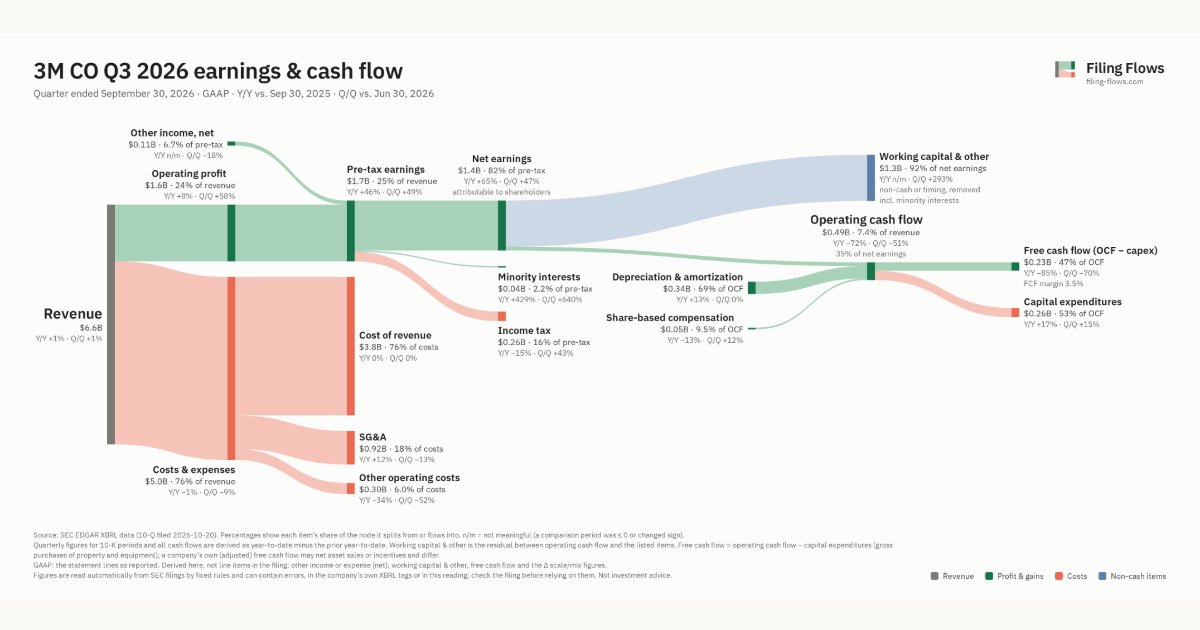
3M made $6.6B in Q3 2026 (+1% Y/Y). Operating margin 23.7%, net earnings $1.4B. See where every dollar goes — costs, profit and cash — as a Sankey from the 10-Q filed Oct 20, 2026.
Drawing the Sankey…
Open the interactive Sankey → click any line for what the company wrote about it, compare Y/Y and Q/Q, export as PNG or PDF
What changed this quarter
Revenue was $6.6B in Q3 2026, up 1% year over year and up 1% from the previous quarter.
Operating profit was $1.6B, a 23.7% margin (up 1.5 points year over year). Of the extra revenue versus Q3 2025, 166% reached operating profit, above the 22% margin then. Total costs fell 1% while revenue rose 1%. The fastest-growing cost line was SG&A (+12%). Net earnings were $1.4B, up 65% year over year. The effective tax rate was 15.6%.
Operating cash flow was $0.49B (down 72% year over year), 34% of net income including minority interests. Non-cash charges added back $0.34B of depreciation and amortization and $0.05B of share-based compensation. Working capital and other items used $1.3B. Capital expenditures of $0.26B left free cash flow of $0.23B.
Quarterly history
| Quarter | Form | Filed | Revenue | Y/Y | Op. margin | Net earnings | Op. cash flow |
|---|---|---|---|---|---|---|---|
| Q3 2026 | 10-Q | Oct 20, 2026 | $6.6B | +1% | 23.7% | $1.4B | $486M |
| Q2 2026 | 10-Q | Jul 21, 2026 | $6.5B | +2% | 15.1% | $938M | $986M |
| Q1 2026 | 10-Q | Apr 21, 2026 | $6.0B | +1% | 23.2% | $653M | $574M |
| Q4 2025 | 10-K | Feb 3, 2026 | $6.1B | +2% | 13.0% | $577M | $1.6B |
| Q3 2025 | 10-Q | Oct 21, 2025 | $6.5B | +4% | 22.2% | $834M | $1.8B |
| Q2 2025 | 10-Q | Jul 18, 2025 | $6.3B | +1% | 18.0% | $723M | −$954M |
| Q1 2025 | 10-Q | Apr 22, 2025 | $6.0B | -1% | 20.9% | $1.1B | −$79.0M |
Charts
Interactive views
The same charts as the app — open one to draw it.
💵Where each $1 goesinteractive
Loading the interactive chart…
🌏Named in Asian annual reportsinteractive
Loading the interactive chart…
🔄Rotation against the market and its industry (RRG)interactive
Loading the interactive chart…
🔍Earnings qualityinteractive
Loading the interactive chart…
⚖️Fair value by methodinteractive
Loading the interactive chart…
🔭Outlook & guidanceinteractive
Loading the interactive chart…
📈Investments: gains and what it boughtinteractive
Loading the interactive chart…
🏭Its industry’s money flow (input-output)interactive
Loading the interactive chart…
About 3M
3M Company was incorporated in 1929 under the laws of the State of Delaware to continue operations begun in 1902. The Company’s ticker symbol is MMM. As used herein, the term “3M” or “Company” includes 3M Company and its subsidiaries unless the context indicates otherwise. In this document, for any references to Note 1 through Note 20, refer to the Notes to Consolidated Financial Statements in Item 8. Available Information : The Securities and Exchange Commission (SEC) maintains a website that contains reports, proxy and information statements, and other information regarding issuers, including the Company, that file electronically with the SEC. The public can obtain any documents that the Company files with the SEC at https://www.sec.gov.
In its own words, from its 10-K, filed Feb 3, 2026.
3M against its Surgical & Medical Instruments & Apparatus peers
The largest companies of the same SEC industry, each at its latest quarter. Revenue growth: +1% against the peers' median +5%. Operating margin: 23.7% against the peers' median 15.9%.
| Company | Quarter | Revenue | Y/Y | Op. margin |
|---|---|---|---|---|
| MMM 3M | Q3 2026 | $6.6B | +1% | 23.7% |
| MDLN Medline | Q3 2026 | $7.9B | +10% | 6.4% |
| SYK Stryker | Q3 2026 | $6.5B | +8% | 15.9% |
| BSX Boston Scientific | Q3 2026 | $5.1B | +1% | 16.1% |
| BDX Becton Dickinson | Q3 FY26 | $5.0B | +5% | 13.3% |
| BAX Baxter International | Q3 2026 | $3.0B | +5% | 7.6% |
| SOLV Solventum | Q3 2026 | $1.9B | -7% | 3.5% |
| RMD ResMed | Q1 FY27 | $1.4B | +6% | 32.0% |
| DXCM DexCom | Q3 2026 | $1.3B | +11% | 24.3% |
Source: 3M 10-Q on SEC EDGAR · CIK 66740 · Surgical & Medical Instruments & Apparatus
Guidance and outlook
13F: who owns MMM and who is buying
More on MMM
History
Every quarter: Q3 2026 results · Q2 2026 results · Q1 2026 results · Q4 2025 results · Q3 2025 results · Q2 2025 results · Q1 2025 results