Filing Flows › Financials › Brighthouse Financial (BHF)
Brighthouse Financial (BHF) earnings and revenue breakdown
Latest: Q3 2026 · 10-Q filed Nov 5, 2026 · Brighthouse Financial (BHF) Q3 2026 earnings results →
Q3 2026 Revenue down 53% year over year to $853M · 38¢ of every $1 of revenue kept as net profit · operating margin 47.4%
Brighthouse Financial made $853M in Q3 2026 (-53% Y/Y). Operating margin 47.4%, net earnings $328M. See where every dollar goes — costs, profit and cash — as a Sankey from the 10-Q filed Nov 5, 2026.
Drawing the Sankey…
Open the interactive Sankey → click any line for what the company wrote about it, compare Y/Y and Q/Q, export as PNG or PDF
What changed this quarter
Revenue was $853.0M in Q3 2026, down 53% year over year and down 47% from the previous quarter.
Operating profit was $404.0M, a 47.4% margin (up 15.1 points year over year). Total costs fell 64% while revenue fell 53%. Net earnings were $328.0M, down 32% year over year. The effective tax rate was 18.3%.
Operating cash flow was −$476.0M. Working capital and other items used $806.0M.
Quarterly history
| Quarter | Form | Filed | Revenue | Y/Y | Op. margin | Net earnings | Op. cash flow |
|---|---|---|---|---|---|---|---|
| Q3 2026 | 10-Q | Nov 5, 2026 | $853M | -53% | 47.4% | $328M | −$476M |
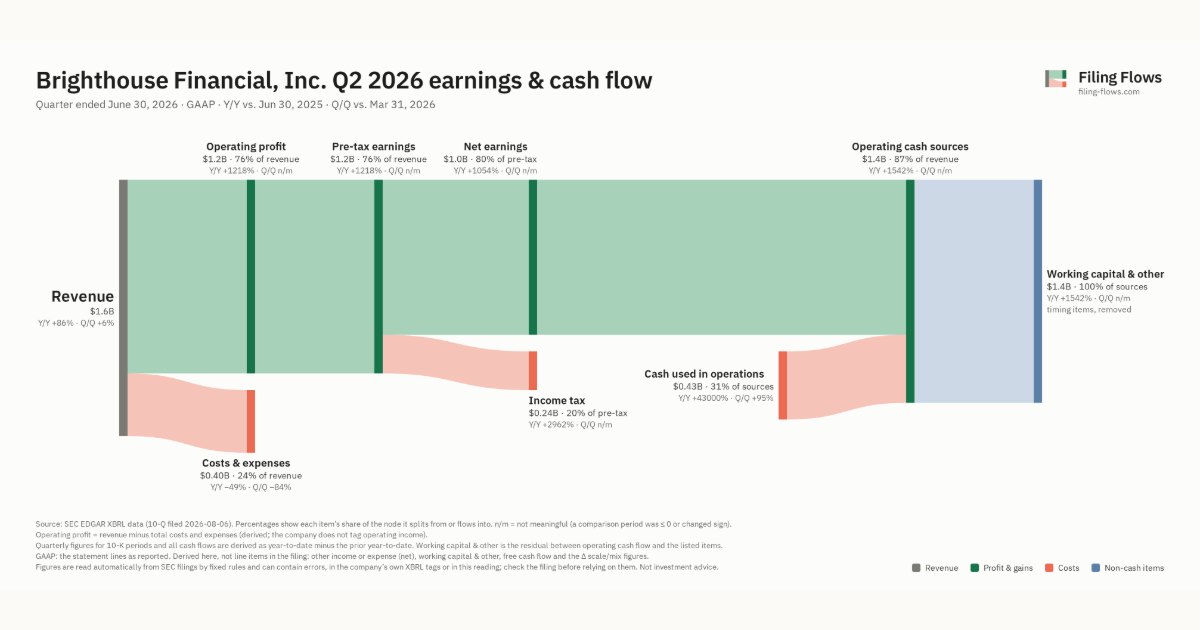
| Q2 2026 | 10-Q | Aug 6, 2026 | $1.6B | +86% | 75.6% | $981M | −$431M |
| Q1 2026 | 10-Q | May 7, 2026 | $1.5B | -36% | -64.6% | −$764M | −$221M |
| Q4 2025 | 10-K | Feb 24, 2026 | $1.7B | +40% | 8.9% | $137M | −$3.0M |
| Q3 2025 | 10-Q | Nov 7, 2025 | $1.8B | -10% | 32.2% | $479M | $117M |
| Q2 2025 | 10-Q | Aug 8, 2025 | $871M | -39% | 10.7% | $85.0M | −$1.0M |
| Q1 2025 | 10-Q | May 9, 2025 | $2.4B | 32× | -14.8% | −$266M | $146M |
Charts
Interactive views
The same charts as the app — open one to draw it.
💵Where each $1 goesinteractive
Loading the interactive chart…
🌏Named in Asian annual reportsinteractive
Loading the interactive chart…
🔄Rotation against the market and its industry (RRG)interactive
Loading the interactive chart…
🔍Earnings qualityinteractive
Loading the interactive chart…
⚖️Fair value by methodinteractive
Loading the interactive chart…
🔭Outlook & guidanceinteractive
Loading the interactive chart…
📈Investments: gains and what it boughtinteractive
Loading the interactive chart…
🏭Its industry’s money flow (input-output)interactive
Loading the interactive chart…
About Brighthouse Financial
We are one of the largest providers of annuity and life insurance products in the U.S. with over 2.0 million annuity contracts and insurance policies in force at December 31, 2025. We deliver our products through multiple independent distribution channels and marketing arrangements with a diverse network of distribution partners. We primarily transact business through our insurance subsidiaries, Brighthouse Life Insurance Company, Brighthouse Life Insurance Company of NY (“BHNY”) and New England Life Insurance Company (“NELICO”); however, NELICO does not currently write new business.
In its own words, from its 10-K, filed Feb 24, 2026.
Brighthouse Financial against its Life Insurance peers
The largest companies of the same SEC industry, each at its latest quarter. Revenue growth: -53% against the peers' median +8%. Operating margin: 47.4% against the peers' median 11.4%.
| Company | Quarter | Revenue | Y/Y | Op. margin |
|---|---|---|---|---|
| BHF Brighthouse Financial | Q3 2026 | $853M | -53% | 47.4% |
| MET Metlife | Q3 2026 | $20.5B | +18% | 8.9% |
| PRU Prudential Financial | Q3 2026 | $14.4B | -19% | 11.4% |
| Metropolitan Life Insurance | Q2 2026 | $9.6B | +2% | 6.0% |
| RGA Reinsurance Group of America | Q3 2026 | $7.5B | +22% | 8.3% |
| CRBG Corebridge Financial | Q3 2026 | $6.2B | +14% | 37.7% |
| LNC Lincoln National | Q3 2026 | $5.5B | +20% | 31.7% |
| Lincoln National Life Insurance | Q2 2026 | $4.3B | +8% | 25.2% |
| ATH-PA Athene Holding | Q3 2026 | $3.1B | -62% | -56.7% |
Source: Brighthouse Financial 10-Q on SEC EDGAR · CIK 1685040 · Life Insurance
Guidance and outlook
13F: who owns BHF and who is buying
More on BHF
- How Brighthouse Financial makes money: revenue by segment
- Brighthouse Financial next earnings date and what analysts expect
- Brighthouse Financial stock forecast, price target and fair value
- Who owns Brighthouse Financial stock: holders, funds and Congress trades
- Brighthouse Financial guidance and outlook
- Is Brighthouse Financial a takeover target? LBO and rumors
History
Every quarter: Q3 2026 results · Q2 2026 results · Q1 2026 results · Q4 2025 results · Q3 2025 results · Q2 2025 results · Q1 2025 results
Compare BHF with
- Brighthouse Financial vs F&G Annuities & Life (BHF vs FG)
- Brighthouse Financial vs Primerica (BHF vs PRI)
- Brighthouse Financial vs Jackson Financial (BHF vs JXN)
- Brighthouse Financial vs Citizens (BHF vs CIA)
- Brighthouse Financial vs Atlantic American (BHF vs AAME)
- Brighthouse Financial vs UTG (BHF vs UTGN)