Filing Flows › Industrials › Carnival (CCL)
Carnival (CCL) earnings and revenue breakdown
Latest: Q3 FY26 · 10-Q filed Sep 29, 2026 · Carnival (CCL) Q3 FY26 earnings results →
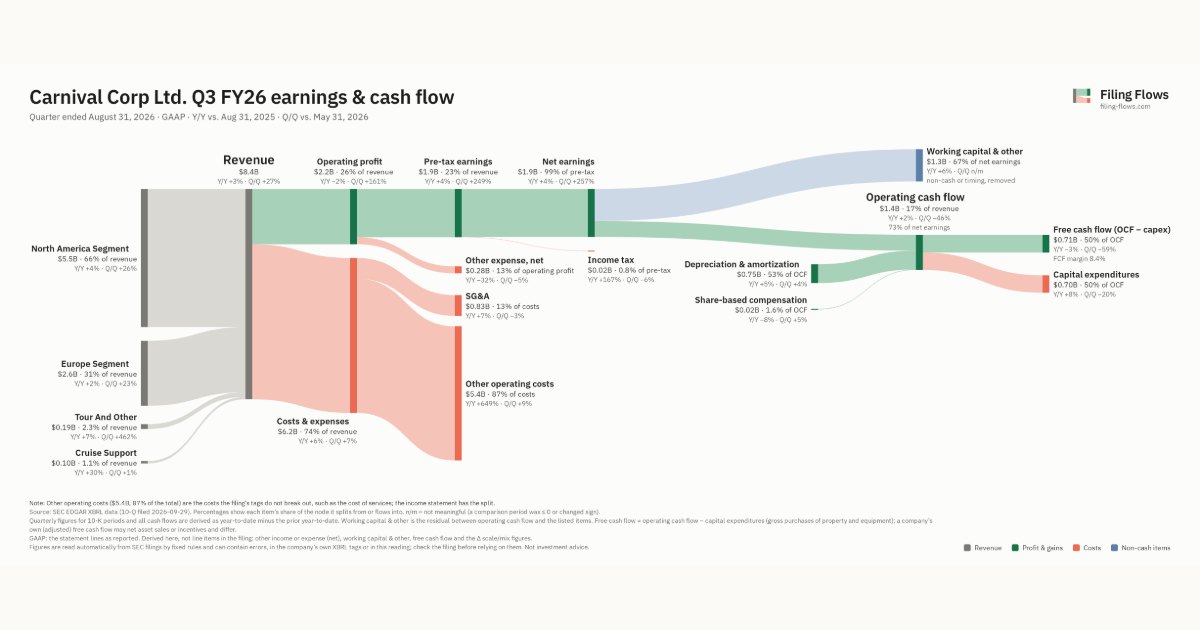
Q3 FY26 Revenue up 4% year over year to $8.4B · 23¢ of every $1 of revenue kept as net profit · operating margin 26.3%
Carnival made $8.4B in Q3 FY26 (+4% Y/Y): North America Segment $5.5B, Europe Segment $2.6B, Tour and Other $191M. Operating margin 26.3%, net earnings $1.9B. See where every dollar goes — costs, profit and cash — as a Sankey from the 10-Q filed Sep 29, 2026.
Drawing the Sankey…
Open the interactive Sankey → click any line for what the company wrote about it, compare Y/Y and Q/Q, export as PNG or PDF
What changed this quarter
Revenue was $8.4B in Q3 FY26, up 3% year over year and up 27% from the previous quarter. North America Segment was the largest line at 66% of revenue. North America Segment added $0.20B year over year (up 4%), 69% of the total change.
Operating profit was $2.2B, a 26.3% margin (down 1.5 points year over year). Operating profit fell $0.05B even though revenue rose $0.28B versus Q3 FY25, so costs grew faster than sales. Total costs grew 6% against revenue growth of 3%. The fastest-growing cost line was Other operating costs (+649%). Net earnings were $1.9B, up 4% year over year. The effective tax rate was 0.8%.
Operating cash flow was $1.4B (up 2% year over year), 73% of net earnings. Non-cash charges added back $0.75B of depreciation and amortization and $0.02B of share-based compensation. Working capital and other items used $1.3B. Capital expenditures of $0.70B left free cash flow of $0.71B.
Quarterly history
| Quarter | Form | Filed | Revenue | Y/Y | Op. margin | Net earnings | Op. cash flow |
|---|---|---|---|---|---|---|---|
| Q3 FY26 | 10-Q | Sep 29, 2026 | $8.4B | +4% | 26.3% | $1.9B | $1.4B |
| Q2 FY26 | 10-Q | Jun 26, 2026 | $6.7B | +5% | 12.8% | $539M | $2.6B |
| Q1 FY26 | 10-Q | Mar 27, 2026 | $6.2B | +6% | 9.8% | $263M | $1.3B |
| Q4 FY25 | 10-K | Jan 27, 2026 | $6.3B | +7% | 11.6% | $422M | $1.5B |
| Q3 FY25 | 10-Q | Sep 29, 2025 | $8.2B | +3% | 27.9% | $1.9B | $1.4B |
| Q2 FY25 | 10-Q | Jun 26, 2025 | $6.3B | +10% | 14.8% | $568M | $2.4B |
| Q4 FY24 | 10-K | Jan 27, 2025 | $5.9B | +10% | 9.4% | $303M | $911M |
Charts
Interactive views
The same charts as the app — open one to draw it.
💵Where each $1 goesinteractive
Loading the interactive chart…
🌏Named in Asian annual reportsinteractive
Loading the interactive chart…
🔄Rotation against the market and its industry (RRG)interactive
Loading the interactive chart…
🔍Earnings qualityinteractive
Loading the interactive chart…
⚖️Fair value by methodinteractive
Loading the interactive chart…
🔭Outlook & guidanceinteractive
Loading the interactive chart…
📈Investments: gains and what it boughtinteractive
Loading the interactive chart…
🏭Its industry’s money flow (input-output)interactive
Loading the interactive chart…
About Carnival
Carnival Corporation was incorporated in Panama in 1974 and Carnival plc was incorporated in England and Wales in 2000. Carnival Corporation and Carnival plc operate a dual listed company (“DLC”), whereby the businesses of Carnival Corporation and Carnival plc are combined through a number of contracts and through provisions in Carnival Corporation’s Articles of Incorporation and By-Laws and Carnival plc’s Articles of Association. The two companies operate as if they are a single economic enterprise with a single executive management team and identical Boards of Directors, but each has retained its separate legal identity. Carnival Corporation and Carnival plc are both public companies with separate stock exchange listings and their own shareholders.
In its own words, from its annual report, filed Jan 27, 2025.
Carnival against its Water Transportation peers
The largest companies of the same SEC industry, each at its latest quarter. Revenue growth: +4% against the peers' median +12%. Operating margin: 26.3% against the peers' median 22.9%.
| Company | Quarter | Revenue | Y/Y | Op. margin |
|---|---|---|---|---|
| CCL Carnival | Q3 FY26 | $8.4B | +4% | 26.3% |
| RCL Royal Caribbean Cruises | Q3 2026 | $5.6B | +9% | 33.5% |
| NCLH Norwegian Cruise Line Holdings | Q3 2026 | $2.9B | +0.3% | 21.2% |
| MATX Matson | Q3 2026 | $1.1B | +26% | 22.9% |
| KEX Kirby | Q3 2026 | $977M | +12% | 15.4% |
| INSW International Seaways | Q3 2026 | $483M | +146% | 72.7% |
| TDW Tidewater | Q2 2026 | $342M | +0.3% | 18.3% |
| OMEX Odyssey Marine Exploration | Q3 2026 | $109K | +79% | n/m |
Source: Carnival 10-Q on SEC EDGAR · CIK 815097 · Water Transportation
Guidance and outlook
More on CCL
History
Every quarter: Q3 FY26 results · Q2 FY26 results · Q1 FY26 results · Q4 FY25 results · Q3 FY25 results · Q2 FY25 results · Q4 FY24 results
- Carnival guidance history: guided vs reported
- Carnival operating margin by quarter
- Carnival net income by quarter
- Carnival free cash flow by quarter
- Carnival capital expenditures by quarter
- Carnival North America Segment revenue by quarter
- Carnival Europe Segment revenue by quarter
- Carnival Tour and Other revenue by quarter