Filing Flows › Industrials › Royal Caribbean Cruises (RCL)
Royal Caribbean Cruises (RCL) earnings and revenue breakdown
Latest: Q3 2026 · 10-Q filed Oct 27, 2026 · Royal Caribbean Cruises (RCL) Q3 2026 earnings results →
Q3 2026 Revenue up 9% year over year to $5.6B · 31¢ of every $1 of revenue kept as net profit · operating margin 33.5%
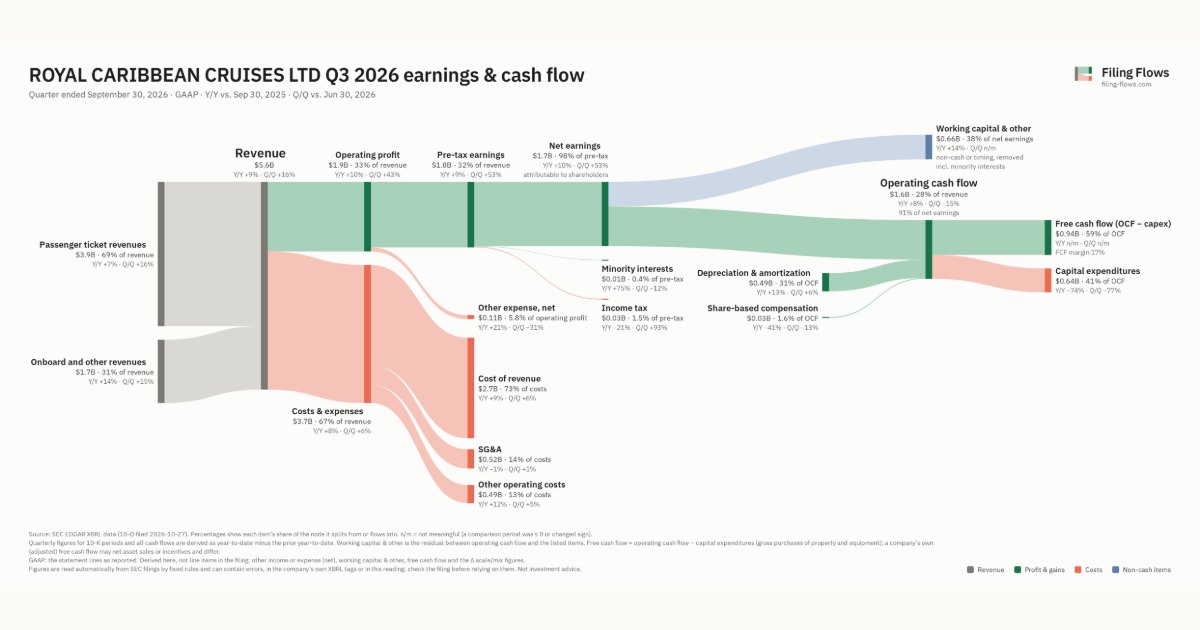
Royal Caribbean Cruises made $5.6B in Q3 2026 (+9% Y/Y): Passenger ticket revenues $3.9B, Onboard and other revenues $1.7B. Operating margin 33.5%, net earnings $1.7B. See where every dollar goes — costs, profit and cash — as a Sankey from the 10-Q filed Oct 27, 2026.
Drawing the Sankey…
Open the interactive Sankey → click any line for what the company wrote about it, compare Y/Y and Q/Q, export as PNG or PDF
What changed this quarter
Revenue was $5.6B in Q3 2026, up 9% year over year and up 16% from the previous quarter. Passenger ticket revenues was the largest line at 69% of revenue. Passenger ticket revenues added $0.25B year over year (up 7%), 55% of the total change.
Operating profit was $1.9B, a 33.5% margin (up 0.3 points year over year). Of the extra revenue versus Q3 2025, 37% reached operating profit, above the 33% margin then. Total costs grew 8% against revenue growth of 9%. The fastest-growing cost line was Other operating costs (+12%). Net earnings were $1.7B, up 10% year over year. The effective tax rate was 1.5%.
Operating cash flow was $1.6B (up 8% year over year), 91% of net earnings. Non-cash charges added back $0.49B of depreciation and amortization and $0.03B of share-based compensation. Working capital and other items used $0.67B. Capital expenditures of $0.64B left free cash flow of $0.94B.
Quarterly history
| Quarter | Form | Filed | Revenue | Y/Y | Op. margin | Net earnings | Op. cash flow |
|---|---|---|---|---|---|---|---|
| Q3 2026 | 10-Q | Oct 27, 2026 | $5.6B | +9% | 33.5% | $1.7B | $1.6B |
| Q2 2026 | 10-Q | Jul 28, 2026 | $4.8B | +6% | 27.0% | $1.1B | $1.9B |
| Q1 2026 | 10-Q | Apr 30, 2026 | $4.5B | +11% | 26.1% | $941M | $1.8B |
| Q4 2025 | 10-K | Feb 11, 2026 | $4.3B | +13% | 21.9% | $754M | $1.6B |
| Q3 2025 | 10-Q | Oct 28, 2025 | $5.1B | +5% | 33.1% | $1.6B | $1.5B |
| Q2 2025 | 10-Q | Jul 29, 2025 | $4.5B | +10% | 29.3% | $1.2B | $1.7B |
| Q1 2025 | 10-Q | Apr 29, 2025 | $4.0B | +7% | 23.6% | $730M | $1.6B |
Charts
Interactive views
The same charts as the app — open one to draw it.
💵Where each $1 goesinteractive
Loading the interactive chart…
🌏Named in Asian annual reportsinteractive
Loading the interactive chart…
🔄Rotation against the market and its industry (RRG)interactive
Loading the interactive chart…
🔍Earnings qualityinteractive
Loading the interactive chart…
⚖️Fair value by methodinteractive
Loading the interactive chart…
🔭Outlook & guidanceinteractive
Loading the interactive chart…
📈Investments: gains and what it boughtinteractive
Loading the interactive chart…
🏭Its industry’s money flow (input-output)interactive
Loading the interactive chart…
About Royal Caribbean Cruises
We are a vacation industry leader, owning and operating three global cruise vacation brands: Royal Caribbean, Celebrity Cruises and Silversea (collectively, our "Global Brands"). We also own a 50% joint venture interest in TUI Cruises GmbH ("TUIC"), which operates the German brands TUI Cruises and Hapag-Lloyd Cruises (collectively, our "Partner Brands"). We account for our investments in our Partner Brands under the equity method of accounting. Together, our Global Brands and our Partner Brands have a combined fleet of 69 ships in the cruise vacation industry with an aggregate capacity of approximately 179,720 berths as of December 31, 2025. Our ships offer a selection of worldwide itineraries that call on more than 1,000 destinations on all seven continents. We also own a growing portfolio of private land-based destinations, including our Perfect Day and Royal Beach Club collections.
In its own words, from its 10-K, filed Feb 11, 2026.
Royal Caribbean Cruises against its Water Transportation peers
The largest companies of the same SEC industry, each at its latest quarter. Revenue growth: +9% against the peers' median +12%. Operating margin: 33.5% against the peers' median 22.9%.
| Company | Quarter | Revenue | Y/Y | Op. margin |
|---|---|---|---|---|
| RCL Royal Caribbean Cruises | Q3 2026 | $5.6B | +9% | 33.5% |
| CCL Carnival | Q3 FY26 | $8.4B | +4% | 26.3% |
| NCLH Norwegian Cruise Line Holdings | Q3 2026 | $2.9B | +0.3% | 21.2% |
| MATX Matson | Q3 2026 | $1.1B | +26% | 22.9% |
| KEX Kirby | Q3 2026 | $977M | +12% | 15.4% |
| INSW International Seaways | Q3 2026 | $483M | +146% | 72.7% |
| TDW Tidewater | Q2 2026 | $342M | +0.3% | 18.3% |
| OMEX Odyssey Marine Exploration | Q3 2026 | $109K | +79% | n/m |
Source: Royal Caribbean Cruises 10-Q on SEC EDGAR · CIK 884887 · Water Transportation
Guidance and outlook
More on RCL
- How Royal Caribbean Cruises makes money: revenue by segment
- Royal Caribbean Cruises stock forecast, price target and fair value
- Who owns Royal Caribbean Cruises stock: holders, funds and Congress trades
- Royal Caribbean Cruises guidance and outlook
- Is Royal Caribbean Cruises a takeover target? LBO and rumors
History
Every quarter: Q3 2026 results · Q2 2026 results · Q1 2026 results · Q4 2025 results · Q3 2025 results · Q2 2025 results · Q1 2025 results
- Royal Caribbean Cruises guidance history: guided vs reported
- Royal Caribbean Cruises operating margin by quarter
- Royal Caribbean Cruises net income by quarter
- Royal Caribbean Cruises free cash flow by quarter
- Royal Caribbean Cruises capital expenditures by quarter
- Royal Caribbean Cruises Passenger ticket revenues revenue by quarter
- Royal Caribbean Cruises Onboard and other revenues revenue by quarter