Filing Flows › Industrials › Norwegian Cruise Line Holdings (NCLH)
Norwegian Cruise Line Holdings (NCLH) earnings and revenue breakdown
Latest: Q3 2026 · 10-Q filed Oct 29, 2026 · Norwegian Cruise Line Holdings (NCLH) Q3 2026 earnings results →
Q3 2026 Revenue up 0% year over year to $2.9B · 17¢ of every $1 of revenue kept as net profit · operating margin 21.2%
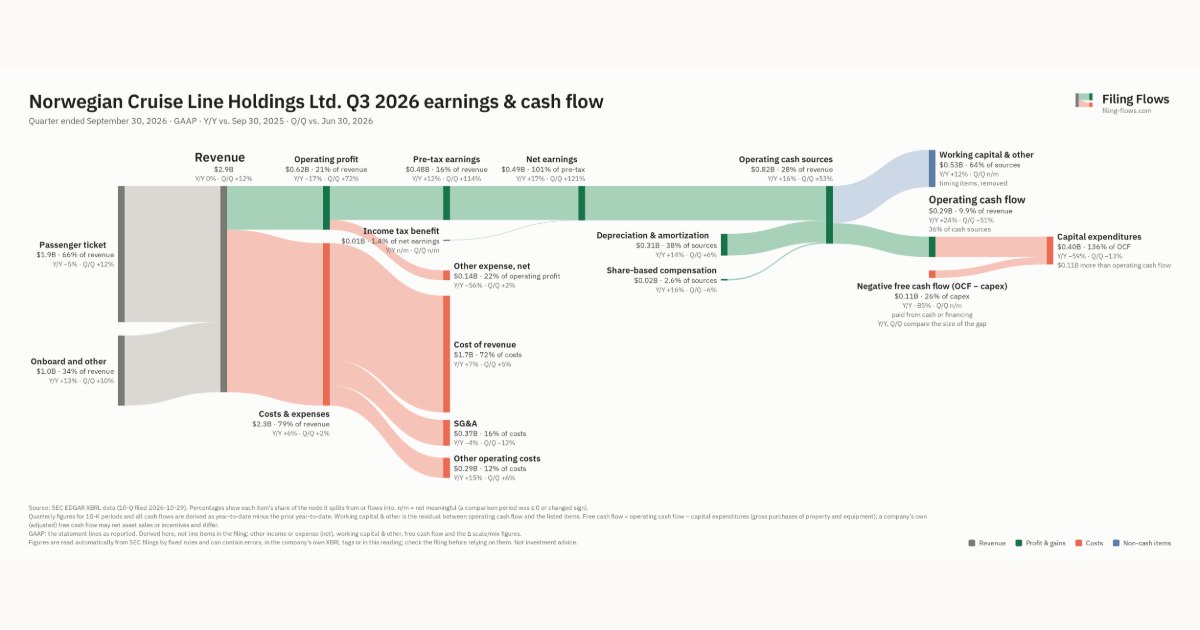
Norwegian Cruise Line Holdings made $2.9B in Q3 2026 (+0.3% Y/Y): Passenger ticket $1.9B, Onboard and other $1.0B. Operating margin 21.2%, net earnings $491M. See where every dollar goes — costs, profit and cash — as a Sankey from the 10-Q filed Oct 29, 2026.
Drawing the Sankey…
Open the interactive Sankey → click any line for what the company wrote about it, compare Y/Y and Q/Q, export as PNG or PDF
What changed this quarter
Revenue was $2.9B in Q3 2026, roughly flat year over year and up 12% from the previous quarter. Passenger ticket was the largest line at 66% of revenue. Onboard and other added $0.11B year over year (up 13%), 1310% of the total change. Passenger ticket declined 5%.
Operating profit was $0.62B, a 21.2% margin (down 4.3 points year over year). Operating profit fell $0.13B even though revenue rose $0.01B versus Q3 2025, so costs grew faster than sales. Total costs grew 6% against flat revenue. The fastest-growing cost line was Other operating costs (+15%). Net earnings were $0.49B, up 17% year over year. The effective tax rate was -1.4%.
Operating cash flow was $0.29B (up 24% year over year), 59% of net earnings. Non-cash charges added back $0.31B of depreciation and amortization and $0.02B of share-based compensation. Working capital and other items used $0.53B. Capital expenditures of $0.40B exceeded it, leaving free cash flow of −$0.11B.
Quarterly history
| Quarter | Form | Filed | Revenue | Y/Y | Op. margin | Net earnings | Op. cash flow |
|---|---|---|---|---|---|---|---|
| Q3 2026 | 10-Q | Oct 29, 2026 | $2.9B | +0.3% | 21.2% | $491M | $292M |
| Q2 2026 | 10-Q | Aug 3, 2026 | $2.6B | +5% | 13.8% | $223M | $603M |
| Q1 2026 | 10-Q | May 4, 2026 | $2.3B | +10% | 10.0% | $105M | $811M |
| Q4 2025 | 10-K | Mar 2, 2026 | $2.2B | +6% | 8.3% | $14.3M | $459M |
| Q3 2025 | 10-Q | Nov 4, 2025 | $2.9B | +5% | 25.5% | $419M | $237M |
| Q2 2025 | 10-Q | Aug 4, 2025 | $2.5B | +6% | 16.8% | $30.0M | $715M |
| Q1 2025 | 10-Q | May 5, 2025 | $2.1B | -3% | 9.4% | −$40.3M | $679M |
Charts
Interactive views
The same charts as the app — open one to draw it.
💵Where each $1 goesinteractive
Loading the interactive chart…
🌏Named in Asian annual reportsinteractive
Loading the interactive chart…
🔄Rotation against the market and its industry (RRG)interactive
Loading the interactive chart…
🔍Earnings qualityinteractive
Loading the interactive chart…
⚖️Fair value by methodinteractive
Loading the interactive chart…
🔭Outlook & guidanceinteractive
Loading the interactive chart…
📈Investments: gains and what it boughtinteractive
Loading the interactive chart…
🏭Its industry’s money flow (input-output)interactive
Loading the interactive chart…
About Norwegian Cruise Line Holdings
Norwegian commenced operations from Miami, Florida in 1966, launching the modern cruise industry by offering weekly departures from Miami, Florida to destinations in the Caribbean. In February 2011, NCLH, a Bermuda limited company, was formed. In January 2013, NCLH completed its initial public offering and the ordinary shares of NCLC were exchanged for the ordinary shares of NCLH, and NCLH became the owner of 100% of the ordinary shares and parent company of NCLC. In November 2014, we completed the acquisition of PCI. In late 2023, in response to the Organisation for Economic Co-operation and Development (“OECD”)’s BEPS 2.0 Pillar 2 global tax reform, the Company restructured its organizational structure by realigning many of its operations across its three different brands into a single jurisdiction, Bermuda.
In its own words, from its 10-K, filed Mar 2, 2026.
Norwegian Cruise Line Holdings against its Water Transportation peers
The largest companies of the same SEC industry, each at its latest quarter. Revenue growth: +0.3% against the peers' median +9%. Operating margin: 21.2% against the peers' median 21.2%.
| Company | Quarter | Revenue | Y/Y | Op. margin |
|---|---|---|---|---|
| NCLH Norwegian Cruise Line Holdings | Q3 2026 | $2.9B | +0.3% | 21.2% |
| CCL Carnival | Q3 FY26 | $8.4B | +4% | 26.3% |
| RCL Royal Caribbean Cruises | Q3 2026 | $5.6B | +9% | 33.5% |
| NCL | Q3 2026 | $2.9B | +0.3% | 21.2% |
| MATX Matson | Q3 2026 | $1.1B | +26% | 22.9% |
| KEX Kirby | Q3 2026 | $977M | +12% | 15.4% |
| INSW International Seaways | Q3 2026 | $483M | +146% | 72.7% |
| TDW Tidewater | Q2 2026 | $342M | +0.3% | 18.3% |
| OMEX Odyssey Marine Exploration | Q3 2026 | $109K | +79% | n/m |
Source: Norwegian Cruise Line Holdings 10-Q on SEC EDGAR · CIK 1513761 · Water Transportation
More on NCLH
- How Norwegian Cruise Line Holdings makes money: revenue by segment
- Norwegian Cruise Line Holdings next earnings date and what analysts expect
- Norwegian Cruise Line Holdings stock forecast, price target and fair value
- Who owns Norwegian Cruise Line Holdings stock: holders, funds and Congress trades
- Norwegian Cruise Line Holdings guidance and outlook
- Is Norwegian Cruise Line Holdings a takeover target? LBO and rumors
- Norwegian Cruise Line Holdings recalls, complaints and regulation
History
Every quarter: Q3 2026 results · Q2 2026 results · Q1 2026 results · Q4 2025 results · Q3 2025 results · Q2 2025 results · Q1 2025 results
- Norwegian Cruise Line Holdings guidance history: guided vs reported
- Norwegian Cruise Line Holdings operating margin by quarter
- Norwegian Cruise Line Holdings net income by quarter
- Norwegian Cruise Line Holdings free cash flow by quarter
- Norwegian Cruise Line Holdings capital expenditures by quarter
- Norwegian Cruise Line Holdings Passenger ticket revenue by quarter
- Norwegian Cruise Line Holdings Onboard and other revenue by quarter