Filing Flows › Industrials › United Rentals North America
United Rentals North America earnings and revenue breakdown
Latest: Q2 2026 · 10-Q filed Jul 22, 2026
Q2 2026 Revenue up 12% year over year to $4.4B · 17¢ of every $1 of revenue kept as net profit · operating margin 25.8%
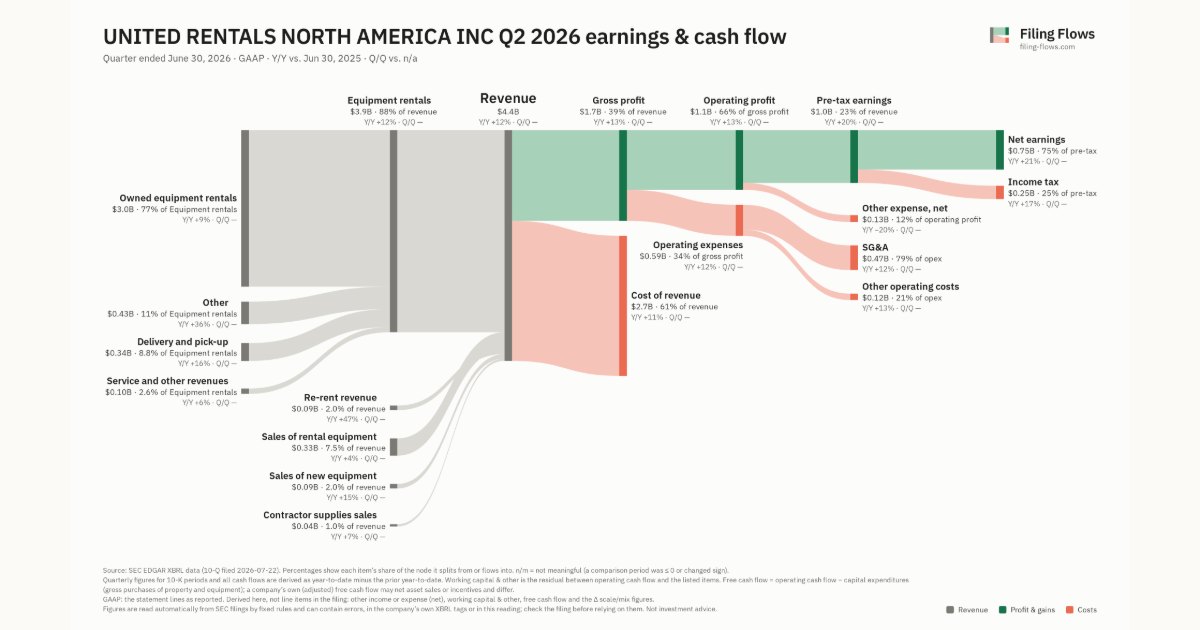
United Rentals North America made $4.4B in Q2 2026 (+12% Y/Y): Equipment rentals $3.9B, Sales of rental equipment $330M, Re-rent revenue $88.0M. Operating margin 25.8%, net earnings $753M. See where every dollar goes — costs, profit and cash — as a Sankey from the 10-Q filed Jul 22, 2026.
Drawing the Sankey…
Open the interactive Sankey → click any line for what the company wrote about it, compare Y/Y and Q/Q, export as PNG or PDF
What changed this quarter
Revenue was $4.4B in Q2 2026, up 12% year over year. Owned equipment rentals was the largest line at 68% of revenue. Owned equipment rentals added $0.25B year over year (up 9%), 53% of the total change.
Gross margin was 39.3%, up 0.4 points from Q2 2025. Operating profit was $1.1B, a 25.8% margin (up 0.4 points year over year). Of the extra revenue versus Q2 2025, 29% reached operating profit, above the 25% margin then. Operating expenses grew 12% against revenue growth of 12%. The fastest-growing cost line was Other operating costs (+13%). Net earnings were $0.75B, up 21% year over year. The effective tax rate was 25.2%.
Quarterly history
| Quarter | Form | Filed | Revenue | Y/Y | Op. margin | Net earnings | Op. cash flow |
|---|---|---|---|---|---|---|---|
| Q2 2026 | 10-Q | Jul 22, 2026 | $4.4B | +12% | 25.8% | $753M | — |
| Q2 2025 | 10-Q | Jul 23, 2025 | $3.9B | — | 25.4% | $622M | $1.3B |
| Q1 2025 | 10-Q | Apr 23, 2025 | $3.7B | +7% | 21.6% | $518M | $1.4B |
Charts
Interactive views
The same charts as the app — open one to draw it.
💵Where each $1 goesinteractive
Loading the interactive chart…
🌏Named in Asian annual reportsinteractive
Loading the interactive chart…
🏭Its industry’s money flow (input-output)interactive
Loading the interactive chart…
About United Rentals North America
United Rentals is the largest equipment rental company in the world, operates throughout the United States and Canada, and has a smaller presence in Europe, Australia and New Zealand. The table below presents key information about our business as of and for the years ended December 31, 2025 and 2024. Our business is discussed in more detail below. The data below should be read in conjunction with, and is qualified by reference to, our Management’s Discussion and Analysis and our consolidated financial statements and notes thereto contained elsewhere in this report.
In its own words, from its 10-K, filed Jan 28, 2026.
United Rentals North America against its Services-Equipment Rental & Leasing, NEC peers
The largest companies of the same SEC industry, each at its latest quarter. Revenue growth: +12% against the peers' median +12%. Operating margin: 25.8% against the peers' median 21.4%.
| Company | Quarter | Revenue | Y/Y | Op. margin |
|---|---|---|---|---|
| United Rentals North America | Q2 2026 | $4.4B | +12% | 25.8% |
| URI United Rentals | Q3 2026 | $4.9B | +16% | 28.8% |
| SUNB Sunbelt Rentals Holdings | Q1 FY27 | $3.1B | +11% | 22.2% |
| EQPT EquipmentShare.com | Q2 2026 | $1.4B | +26% | 6.4% |
| UPBD Upbound Group | Q3 2026 | $1.1B | -2% | 6.2% |
| PRG Prog Holdings | Q3 2026 | $726M | +26% | 9.1% |
| Sumisho Air Lease | Q3 2026 | $593M | -18% | 21.4% |
| CTOS Custom Truck One Source | Q3 2026 | $495M | +3% | 7.7% |
| Aircastle | Q2 FY27 | $283M | +24% | 28.4% |
Source: United Rentals North America 10-Q on SEC EDGAR · CIK 1047166 · Services-Equipment Rental & Leasing, NEC