Filing Flows › Industrials › Sunbelt Rentals Holdings (SUNB)
Sunbelt Rentals Holdings (SUNB) earnings and revenue breakdown
Latest: Q1 FY27 · 10-Q filed Sep 9, 2026 · Sunbelt Rentals Holdings (SUNB) Q1 FY27 earnings results →
Q1 FY27 Revenue up 11% year over year to $3.1B · 14¢ of every $1 of revenue kept as net profit · operating margin 22.2%
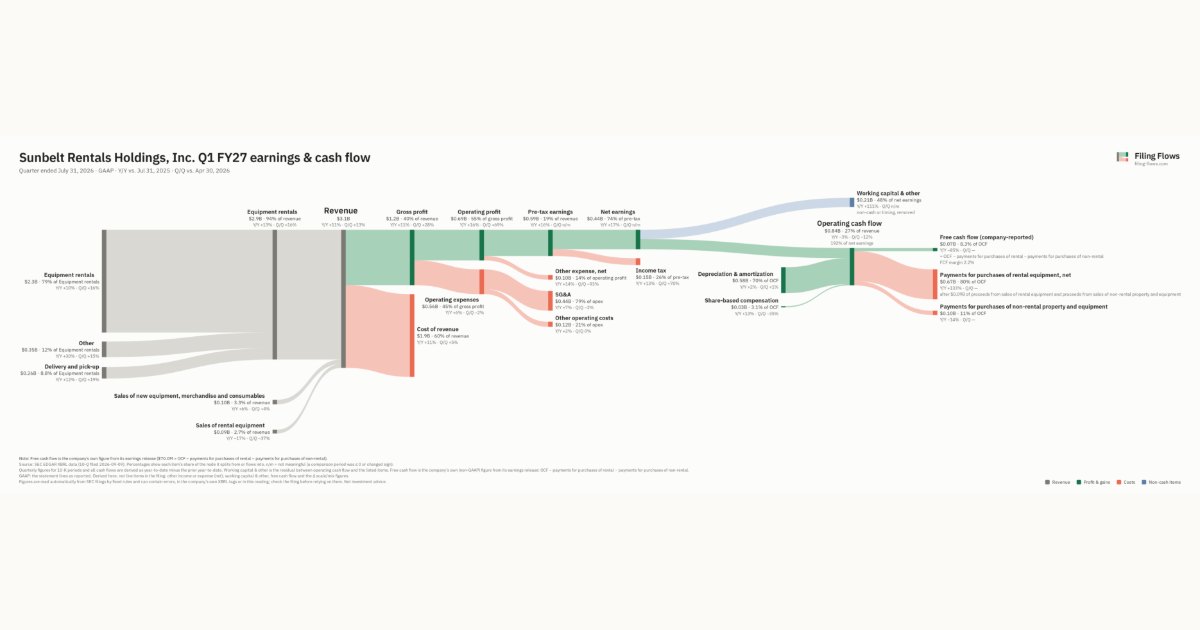
Sunbelt Rentals Holdings made $3.1B in Q1 FY27 (+11% Y/Y): Equipment rentals $2.9B, Sales of new equipment, merchandise and consumables $103M, Sales of rental equipment $85.0M. Operating margin 22.2%, net earnings $438M. See where every dollar goes — costs, profit and cash — as a Sankey from the 10-Q filed Sep 9, 2026.
Drawing the Sankey…
Open the interactive Sankey → click any line for what the company wrote about it, compare Y/Y and Q/Q, export as PNG or PDF
What changed this quarter
Revenue was $3.1B in Q1 FY27, up 11% year over year and up 13% from the previous quarter. Equipment rentals was the largest line at 74% of revenue. Equipment rentals added $0.22B year over year (up 10%), 70% of the total change. Sales of rental equipment declined 17%.
Gross margin was 40.1%, unchanged from a year earlier. Operating profit was $0.69B, a 22.2% margin (up 0.9 points year over year). Of the extra revenue versus a year earlier, 30% reached operating profit, above the 21% margin then. Operating expenses grew 6% against revenue growth of 11%. Net earnings were $0.44B, up 17% year over year. The effective tax rate was 25.9%.
Operating cash flow was $0.84B (down 3% year over year), 192% of net earnings. Non-cash charges added back $0.58B of depreciation and amortization and $0.03B of share-based compensation. Working capital and other items used $0.21B. After payments for purchases of rental equipment, net ($0.67B) and payments for purchases of non-rental property and equipment ($0.10B), free cash flow as the company reports it was $0.07B.
Quarterly history
| Quarter | Form | Filed | Revenue | Y/Y | Op. margin | Net earnings | Op. cash flow |
|---|---|---|---|---|---|---|---|
| Q1 FY27 | 10-Q | Sep 9, 2026 | $3.1B | +11% | 22.2% | $438M | $840M |
| Q4 FY26 | 10-K | Jun 23, 2026 | $2.8B | +9% | 14.9% | $226M | $950M |
| Q3 FY26 | 10-Q | Mar 12, 2026 | $2.6B | +3% | 18.7% | $290M | — |
Charts
Interactive views
The same charts as the app — open one to draw it.
💵Where each $1 goesinteractive
Loading the interactive chart…
🌏Named in Asian annual reportsinteractive
Loading the interactive chart…
🔄Rotation against the market and its industry (RRG)interactive
Loading the interactive chart…
🔍Earnings qualityinteractive
Loading the interactive chart…
⚖️Fair value by methodinteractive
Loading the interactive chart…
🔭Outlook & guidanceinteractive
Loading the interactive chart…
📈Investments: gains and what it boughtinteractive
Loading the interactive chart…
🏭Its industry’s money flow (input-output)interactive
Loading the interactive chart…
About Sunbelt Rentals Holdings
We believe we are one of the largest international equipment rental companies by rental revenue, with a network o f 1,611 stores across North America and the United Kingdom as of April 30, 2026 . We conduct our equipment rental operations under the name “Sunbelt Rentals.” We believe that Sunbelt Rentals is the second largest equipment rental business in North America and the largest equipment rental company in the United Kingdom, in each case, by rental revenue. In the fiscal year ended April 30, 2026 , we generated revenue of $11,154 million, operating income of $2,181 million and adjusted operating profit of $2,500 million and in the fiscal year ended April 30, 2025 , we generated revenue of $10,791 million, operating income of $2,499 million and adjusted operating profit of $2,615 million.
In its own words, from its 10-K, filed Jun 23, 2026.
Sunbelt Rentals Holdings against its Services-Equipment Rental & Leasing, NEC peers
The largest companies of the same SEC industry, each at its latest quarter. Revenue growth: +11% against the peers' median +12%. Operating margin: 22.2% against the peers' median 21.4%.
| Company | Quarter | Revenue | Y/Y | Op. margin |
|---|---|---|---|---|
| SUNB Sunbelt Rentals Holdings | Q1 FY27 | $3.1B | +11% | 22.2% |
| URI United Rentals | Q3 2026 | $4.9B | +16% | 28.8% |
| United Rentals North America | Q2 2026 | $4.4B | +12% | 25.8% |
| EQPT EquipmentShare.com | Q2 2026 | $1.4B | +26% | 6.4% |
| UPBD Upbound Group | Q3 2026 | $1.1B | -2% | 6.2% |
| PRG Prog Holdings | Q3 2026 | $726M | +26% | 9.1% |
| Sumisho Air Lease | Q3 2026 | $593M | -18% | 21.4% |
| CTOS Custom Truck One Source | Q3 2026 | $495M | +3% | 7.7% |
| Aircastle | Q2 FY27 | $283M | +24% | 28.4% |
Source: Sunbelt Rentals Holdings 10-Q on SEC EDGAR · CIK 2083785 · Services-Equipment Rental & Leasing, NEC
13F: who owns SUNB and who is buying
More on SUNB
- How Sunbelt Rentals Holdings makes money: revenue by segment
- Sunbelt Rentals Holdings stock forecast, price target and fair value
- Who owns Sunbelt Rentals Holdings stock: holders, funds and Congress trades
- Is Sunbelt Rentals Holdings a takeover target? LBO and rumors
- Sunbelt Rentals Holdings recalls, complaints and regulation
History
Every quarter: Q1 FY27 results · Q4 FY26 results · Q3 FY26 results
- Sunbelt Rentals Holdings guidance history: guided vs reported
- Sunbelt Rentals Holdings gross margin by quarter
- Sunbelt Rentals Holdings operating margin by quarter
- Sunbelt Rentals Holdings net income by quarter
- Sunbelt Rentals Holdings Equipment rentals revenue by quarter
- Sunbelt Rentals Holdings Sales of new equipment, merchandise and consumables revenue by quarter
- Sunbelt Rentals Holdings Sales of rental equipment revenue by quarter