Filing Flows › Utilities › Northwest Pipeline LLC
Northwest Pipeline LLC earnings and revenue breakdown
Latest: Q3 2026 · 10-Q filed Nov 2, 2026
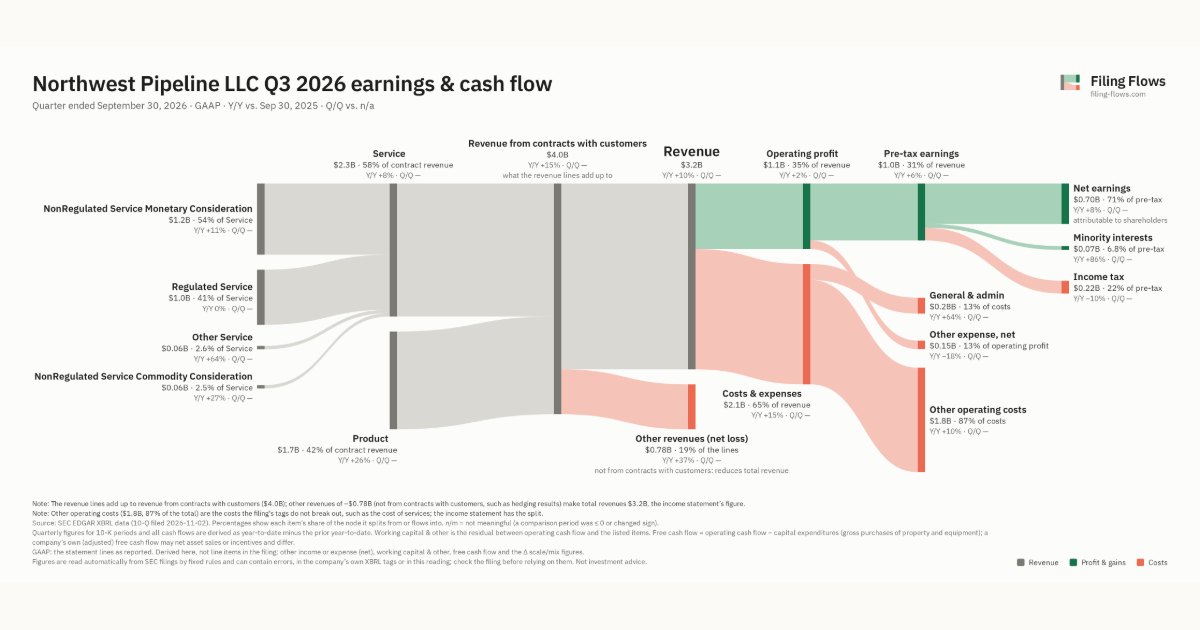
Q3 2026 Revenue up 10% year over year to $3.2B · 22¢ of every $1 of revenue kept as net profit · operating margin 35.2%
Northwest Pipeline LLC made $3.2B in Q3 2026 (+10% Y/Y). Operating margin 35.2%, net earnings $700M. See where every dollar goes — costs, profit and cash — as a Sankey from the 10-Q filed Nov 2, 2026.
Drawing the Sankey…
Open the interactive Sankey → click any line for what the company wrote about it, compare Y/Y and Q/Q, export as PNG or PDF
What changed this quarter
Revenue was $3.2B in Q3 2026, up 10% year over year. Product was the largest line at 53% of revenue. Product added $0.35B year over year (up 26%), 116% of the total change.
Operating profit was $1.1B, a 35.2% margin (down 2.7 points year over year). Of the extra revenue versus Q3 2025, 9% reached operating profit, below the 38% margin then. Total costs grew 15% against revenue growth of 10%. The fastest-growing cost line was Other operating costs (+10%). Net earnings were $0.70B, up 8% year over year. The effective tax rate was 22.4%.
Operating cash flow was $1.5B (up 5% year over year), 196% of net income including minority interests. Non-cash charges added back $0.62B of depreciation and amortization and $0.03B of share-based compensation. Working capital and other items added $0.09B. Capital expenditures of $2.5B exceeded it, leaving free cash flow of −$1.0B.
Quarterly history
| Quarter | Form | Filed | Revenue | Y/Y | Op. margin | Net earnings | Op. cash flow |
|---|---|---|---|---|---|---|---|
| Q3 2026 | 10-Q | Nov 2, 2026 | $3.2B | +10% | 35.2% | $700M | $1.5B |
| Q2 2026 | 10-Q | Aug 3, 2026 | $3.1B | +10% | 38.7% | $827M | $1.4B |
| Q1 2026 | 10-Q | May 4, 2026 | $3.0B | -0.6% | 43.6% | $865M | $1.6B |
| Q4 2025 | 10-K | Feb 24, 2026 | $3.2B | +17% | 32.8% | $734M | $1.6B |
| Q3 2025 | 10-Q | Nov 3, 2025 | $2.9B | +10% | 37.9% | $647M | $1.4B |
| Q2 2025 | 10-Q | Aug 4, 2025 | $2.8B | +19% | 34.0% | $546M | — |
| Q4 2024 | 10-K | Feb 25, 2025 | $10.2B | -4% | 31.4% | $2.1B | $4.8B |
Charts
Interactive views
The same charts as the app — open one to draw it.
💵Where each $1 goesinteractive
Loading the interactive chart…
🌏Named in Asian annual reportsinteractive
Loading the interactive chart…
🏭Its industry’s money flow (input-output)interactive
Loading the interactive chart…
Customers and suppliers named in filings
Sells to
About Northwest Pipeline LLC
This report includes information for multiple registrants, specifically The Williams Companies, Inc. (Williams), as well as Transcontinental Gas Pipe Line Company, LLC (Transco) and Northwest Pipeline LLC (NWP) both of which are wholly owned subsidiaries of Williams (collectively, the Registrants). References to subsidiaries by name, including equity-method investees, Transco, and NWP, refer exclusively to those businesses and operations. Williams is an energy company committed to being the leader in providing infrastructure that safely delivers natural gas products to reliably fuel the clean energy economy. Williams has operations in 11 supply areas that provide natural gas gathering and processing (G&P), transmission and storage services; NGL fractionation, transportation, and storage services; and marketing services to approximately 800 customers.
In its own words, from its 10-K, filed Feb 24, 2026.
Northwest Pipeline LLC against its Natural Gas Transmission peers
The largest companies of the same SEC industry, each at its latest quarter. Revenue growth: +10% against the peers' median +30%. Operating margin: 35.2% against the peers' median 25.6%.
| Company | Quarter | Revenue | Y/Y | Op. margin |
|---|---|---|---|---|
| Northwest Pipeline LLC | Q3 2026 | $3.2B | +10% | 35.2% |
| ET Energy Transfer LP | Q3 2026 | $37.1B | +86% | 7.5% |
| EPD Enterprise Products Partners L.P. | Q3 2026 | $17.9B | +49% | 11.1% |
| TRGP Targa Resources | Q3 2026 | $5.6B | +35% | 19.6% |
| KMI Kinder Morgan | Q3 2026 | $4.5B | +9% | 25.6% |
| WMB Williams Companies | Q3 2026 | $3.2B | +10% | 35.2% |
| Western Midstream Operating, LP | Q2 2026 | $1.2B | +30% | 43.0% |
| WES Western Midstream Partners, LP | Q3 2026 | $1.2B | +25% | 38.6% |
| NGL NGL Energy Partners LP | Q2 FY27 | $987M | +46% | 2.4% |
Source: Northwest Pipeline LLC 10-Q on SEC EDGAR · CIK 110019 · Natural Gas Transmission