Filing Flows › Financials › Alliancebernstein L.P.
Alliancebernstein L.P. earnings and revenue breakdown
Latest: Q3 2026 · 10-Q filed Oct 29, 2026
Q3 2026 Revenue up 8% year over year to $1.2B · 21¢ of every $1 of revenue kept as net profit · operating margin 20.1%
Alliancebernstein L.P. made $1.2B in Q3 2026 (+8% Y/Y). Operating margin 20.1%, net earnings $257M. See where every dollar goes — costs, profit and cash — as a Sankey from the 10-Q filed Oct 29, 2026.
Drawing the Sankey…
Open the interactive Sankey → click any line for what the company wrote about it, compare Y/Y and Q/Q, export as PNG or PDF
What changed this quarter
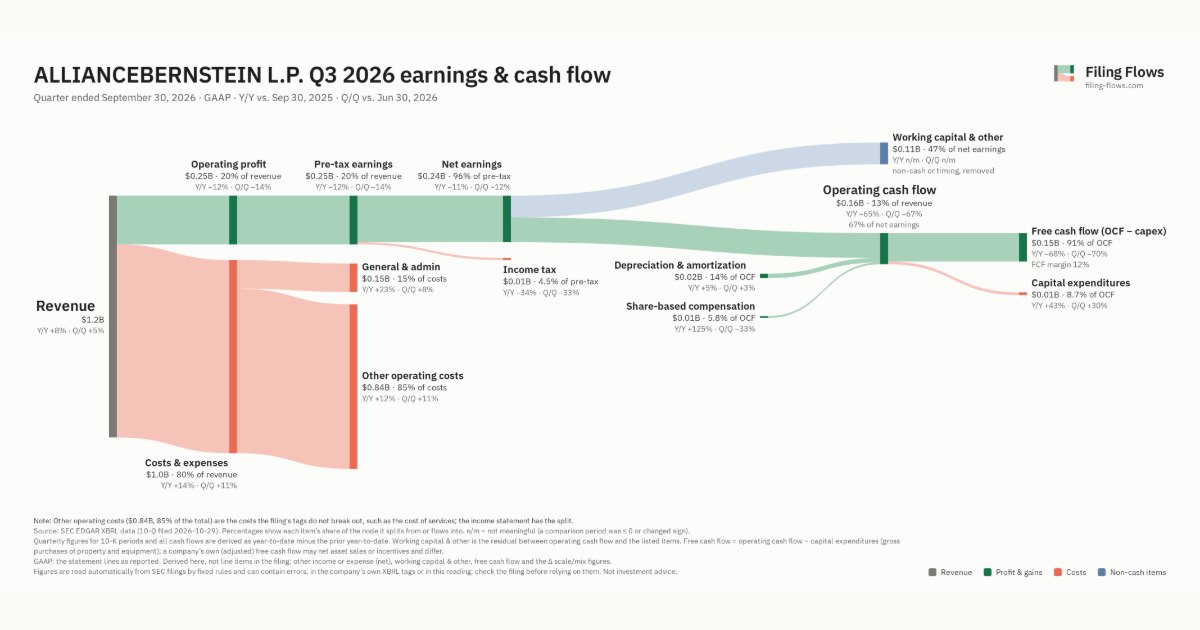
Revenue was $1.2B in Q3 2026, up 8% year over year and up 5% from the previous quarter.
Operating profit was $0.25B, a 20.1% margin (down 4.5 points year over year). Operating profit fell $0.03B even though revenue rose $0.09B versus Q3 2025, so costs grew faster than sales. Total costs grew 14% against revenue growth of 8%. The fastest-growing cost line was General & admin (+23%). Net earnings were $0.26B, down 1% year over year ($0.24B including minority interests, which bore $0.02B of losses). The effective tax rate was 4.5%.
Operating cash flow was $0.16B (down 65% year over year), 67% of net income including minority interests. Non-cash charges added back $0.02B of depreciation and amortization and $0.01B of share-based compensation. Working capital and other items used $0.11B. Capital expenditures of $0.01B left free cash flow of $0.15B.
Quarterly history
| Quarter | Form | Filed | Revenue | Y/Y | Op. margin | Net earnings | Op. cash flow |
|---|---|---|---|---|---|---|---|
| Q3 2026 | 10-Q | Oct 29, 2026 | $1.2B | +8% | 20.1% | $257M | $159M |
| Q2 2026 | 10-Q | Jul 31, 2026 | $1.2B | +7% | 24.4% | $255M | $489M |
| Q1 2026 | 10-Q | May 1, 2026 | $1.2B | +11% | 26.9% | $295M | $461M |
| Q4 2025 | 10-K | Feb 12, 2026 | $1.2B | -3% | 24.9% | $292M | $84.8M |
| Q3 2025 | 10-Q | Oct 23, 2025 | $1.2B | +4% | 24.6% | $259M | $458M |
| Q2 2025 | 10-Q | Jul 24, 2025 | $1.1B | +5% | 20.1% | $210M | $341M |
| Q1 2025 | 10-Q | Apr 24, 2025 | $1.1B | -3% | 21.5% | $221M | $149M |
Charts
Interactive views
The same charts as the app — open one to draw it.
💵Where each $1 goesinteractive
Loading the interactive chart…
🌏Named in Asian annual reportsinteractive
Loading the interactive chart…
🏭Its industry’s money flow (input-output)interactive
Loading the interactive chart…
About Alliancebernstein L.P.
The words “ we ” and “ our ” in this Form 10-K refer collectively to AB Holding and AB and its subsidiaries, or to their officers and employees. Similarly, the words “ company ” and “ firm ” refer to both AB Holding and AB. Where the context requires distinguishing between AB Holding and AB, we identify which company is being discussed. Cross-references are in italics. We use “ global ” in this Form 10-K to refer to all nations, including the United States; we use “ international ” or “ non-U.S. ” to refer to nations other than the United States.
In its own words, from its 10-K, filed Feb 12, 2026.
Alliancebernstein L.P. against its Investment Advice peers
The largest companies of the same SEC industry, each at its latest quarter. Revenue growth: +8% against the peers' median +6%. Operating margin: 20.1% against the peers' median 24.0%.
| Company | Quarter | Revenue | Y/Y | Op. margin |
|---|---|---|---|---|
| Alliancebernstein L.P. | Q3 2026 | $1.2B | +8% | 20.1% |
| KKR KKR | Q2 2026 | $5.7B | +12% | 24.0% |
| AMP Ameriprise Financial | Q3 2026 | $5.2B | +6% | 28.9% |
| APO Apollo Global Management | Q3 2026 | $4.7B | -52% | -30.9% |
| BX Blackstone | Q3 2026 | $3.1B | -0.8% | 46.9% |
| BEN Franklin Templeton | Q4 FY26 | $2.4B | +4% | 14.6% |
| TROW Price T Rowe Group | Q3 2026 | $2.0B | +6% | 38.4% |
| IVZ Invesco | Q3 2026 | $1.9B | +14% | 23.3% |
| BAM Brookfield Asset Management | Q2 2026 | $1.8B | +61% | 62.4% |
Source: Alliancebernstein L.P. 10-Q on SEC EDGAR · CIK 1109448 · Investment Advice