Filing Flows › Utilities › Southern Power
Southern Power earnings and revenue breakdown
Latest: Q3 2026 · 10-Q filed Nov 5, 2026
Q3 2026 Revenue up 13% year over year to $8.8B · 23¢ of every $1 of revenue kept as net profit · operating margin 33.9%
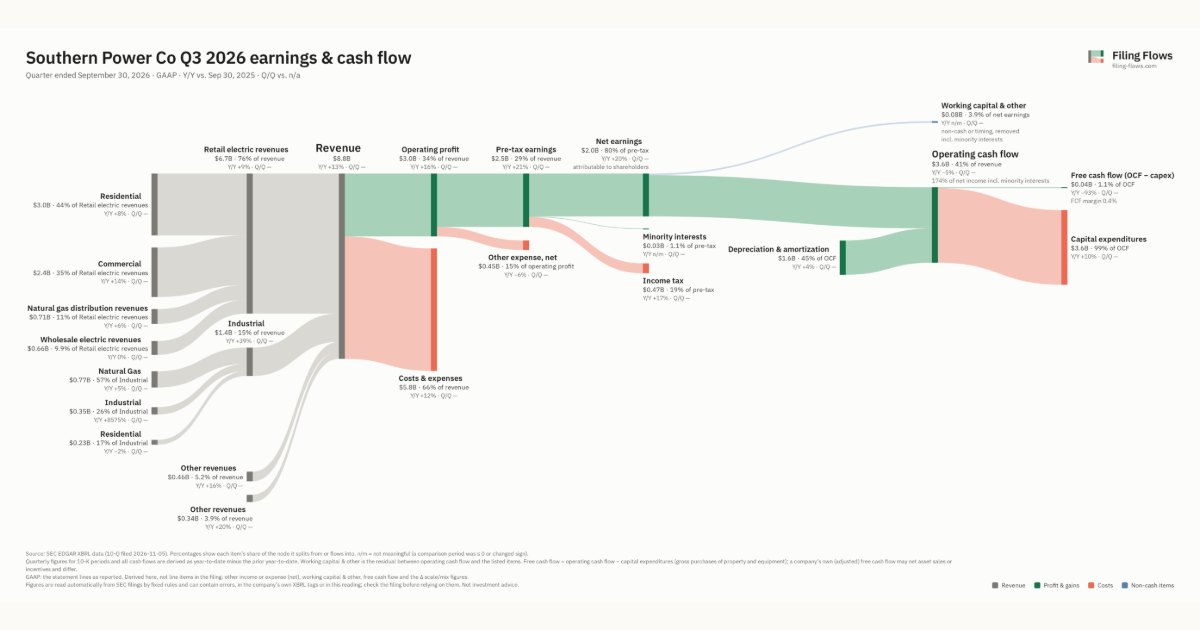
Southern Power made $8.8B in Q3 2026 (+13% Y/Y): Retail electric revenues $6.7B, Industrial $1.4B, Other revenues $462M. Operating margin 33.9%, net earnings $2.0B. See where every dollar goes — costs, profit and cash — as a Sankey from the 10-Q filed Nov 5, 2026.
Drawing the Sankey…
Open the interactive Sankey → click any line for what the company wrote about it, compare Y/Y and Q/Q, export as PNG or PDF
What changed this quarter
Revenue was $8.8B in Q3 2026, up 13% year over year. Residential was the largest line at 33% of revenue. Industrial added $0.34B year over year (up 8575%), 34% of the total change. Residential declined 2%.
Operating profit was $3.0B, a 33.9% margin (up 0.8 points year over year). Of the extra revenue versus Q3 2025, 40% reached operating profit, above the 33% margin then. Total costs grew 12% against revenue growth of 13%. Net earnings were $2.0B, up 20% year over year. The effective tax rate was 18.5%.
Operating cash flow was $3.6B (down 5% year over year), 174% of net earnings. Non-cash charges added back $1.6B of depreciation and amortization. Capital expenditures of $3.6B left free cash flow of $0.04B.
Quarterly history
| Quarter | Form | Filed | Revenue | Y/Y | Op. margin | Net earnings | Op. cash flow |
|---|---|---|---|---|---|---|---|
| Q3 2026 | 10-Q | Nov 5, 2026 | $8.8B | +13% | 33.9% | $2.0B | $3.6B |
| Q2 2026 | 10-Q | Jul 30, 2026 | $7.0B | +0.1% | 25.5% | $1.2B | $3.1B |
| Q1 2026 | 10-Q | Apr 30, 2026 | $8.4B | +8% | 24.0% | $1.4B | $1.2B |
| Q4 2025 | 10-K | Feb 19, 2026 | $7.0B | +10% | 13.1% | $416M | $2.6B |
| Q3 2025 | 10-Q | Oct 30, 2025 | $7.8B | +8% | 33.2% | $1.7B | $3.8B |
| Q2 2025 | 10-Q | Jul 31, 2025 | $7.0B | +8% | 25.3% | $880M | — |
Charts
Interactive views
The same charts as the app — open one to draw it.
💵Where each $1 goesinteractive
Loading the interactive chart…
🌏Named in Asian annual reportsinteractive
Loading the interactive chart…
🏭Its industry’s money flow (input-output)interactive
Loading the interactive chart…
About Southern Power
Southern Company is a holding company that owns all of the outstanding common stock of three traditional electric operating companies, Southern Power Company, and Southern Company Gas. • The traditional electric operating companies – Alabama Power, Georgia Power, and Mississippi Power – are each vertically integrated utilities providing electric service to retail customers in three Southeastern states in addition to wholesale customers in the Southeast.
In its own words, from its 10-K, filed Feb 19, 2026.
Southern Power against its Electric Services peers
The largest companies of the same SEC industry, each at its latest quarter. Revenue growth: +13% against the peers' median +13%. Operating margin: 33.9% against the peers' median 29.7%.
| Company | Quarter | Revenue | Y/Y | Op. margin |
|---|---|---|---|---|
| Southern Power | Q3 2026 | $8.8B | +13% | 33.9% |
| SO Southern | Q3 2026 | $8.8B | +13% | 33.9% |
| NEE NextEra Energy | Q3 2026 | $8.1B | +2% | 32.4% |
| Florida Power & Light | Q2 2026 | $7.5B | +12% | 29.7% |
| CEG Constellation Energy | Q2 2026 | $7.5B | +23% | 7.7% |
| NRG NRG Energy | Q2 2026 | $7.5B | +11% | 13.0% |
| AEP Texas | Q3 2026 | $6.8B | +14% | 26.5% |
| VST Vistra | Q3 2026 | $6.3B | +28% | 26.9% |
| D Dominion Energy | Q3 2026 | $5.6B | +24% | 32.8% |
Source: Southern Power 10-Q on SEC EDGAR · CIK 1160661 · Electric Services