Filing Flows › Utilities › Vistra (VST)
Vistra (VST) earnings and revenue breakdown
Latest: Q3 2026 · 8-K filed Nov 6, 2026
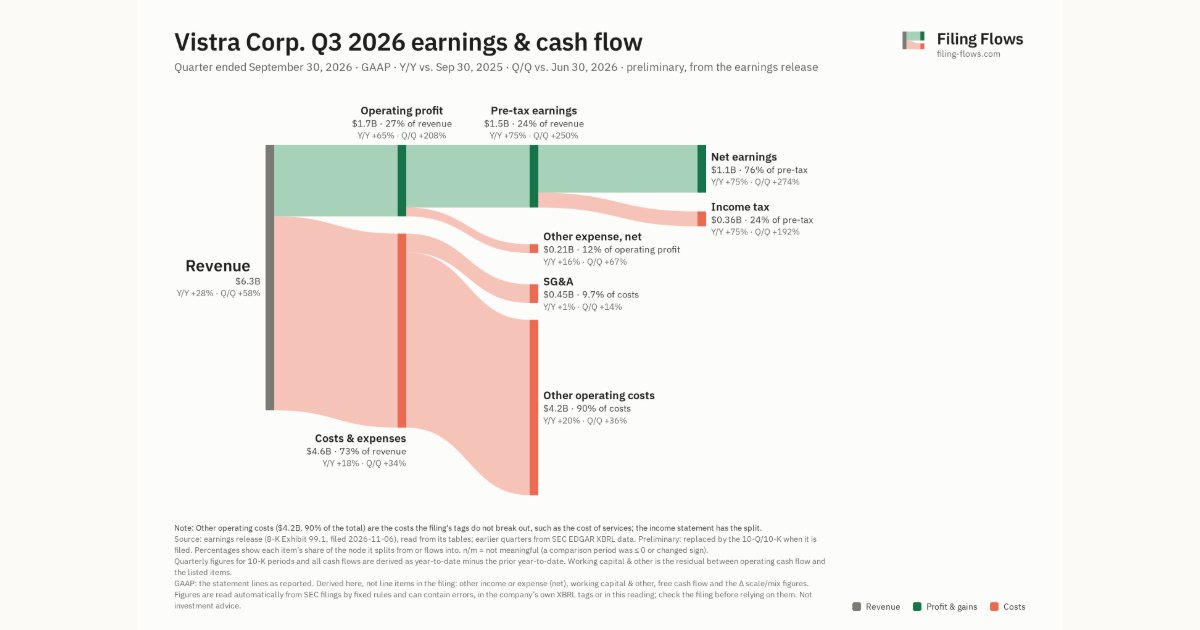
Q3 2026 Revenue up 28% year over year to $6.3B · 18¢ of every $1 of revenue kept as net profit · operating margin 26.9%
Vistra made $6.3B in Q3 2026 (+28% Y/Y). Operating margin 26.9%, net earnings $1.1B. See where every dollar goes — costs, profit and cash — as a Sankey from the 8-K filed Nov 6, 2026 (preliminary, from the earnings release).
Drawing the Sankey…
Open the interactive Sankey → click any line for what the company wrote about it, compare Y/Y and Q/Q, export as PNG or PDF
What changed this quarter
Revenue was $6.3B in Q3 2026, up 28% year over year and up 58% from the previous quarter.
Operating profit was $1.7B, a 26.9% margin (up 6.0 points year over year). Of the extra revenue versus Q3 2025, 49% reached operating profit, above the 21% margin then. Total costs grew 18% against revenue growth of 28%. The fastest-growing cost line was Other operating costs (+20%). Net earnings were $1.1B, up 75% year over year. The effective tax rate was 23.8%.
Quarterly history
| Quarter | Form | Filed | Revenue | Y/Y | Op. margin | Net earnings | Op. cash flow |
|---|---|---|---|---|---|---|---|
| Q3 2026 | 8-K | Nov 6, 2026 | $6.3B | +28% | 26.9% | $1.1B | — |
| Q2 2026 | 10-Q | Aug 10, 2026 | $4.0B | -6% | 13.8% | $305M | $1.0B |
| Q1 2026 | 10-Q | May 8, 2026 | $5.6B | +43% | 26.6% | $1.0B | $1.2B |
| Q4 2025 | 10-K | Feb 27, 2026 | $4.6B | +14% | 10.3% | $233M | $1.4B |
| Q3 2025 | 10-Q | Nov 7, 2025 | $5.0B | -21% | 20.9% | $652M | $1.5B |
| Q2 2025 | 10-Q | Aug 8, 2025 | $4.2B | +10% | 12.1% | $327M | $572M |
| Q1 2025 | 10-Q | May 8, 2025 | $3.9B | +29% | -3.1% | −$268M | $599M |
Charts
In supply chains and themes
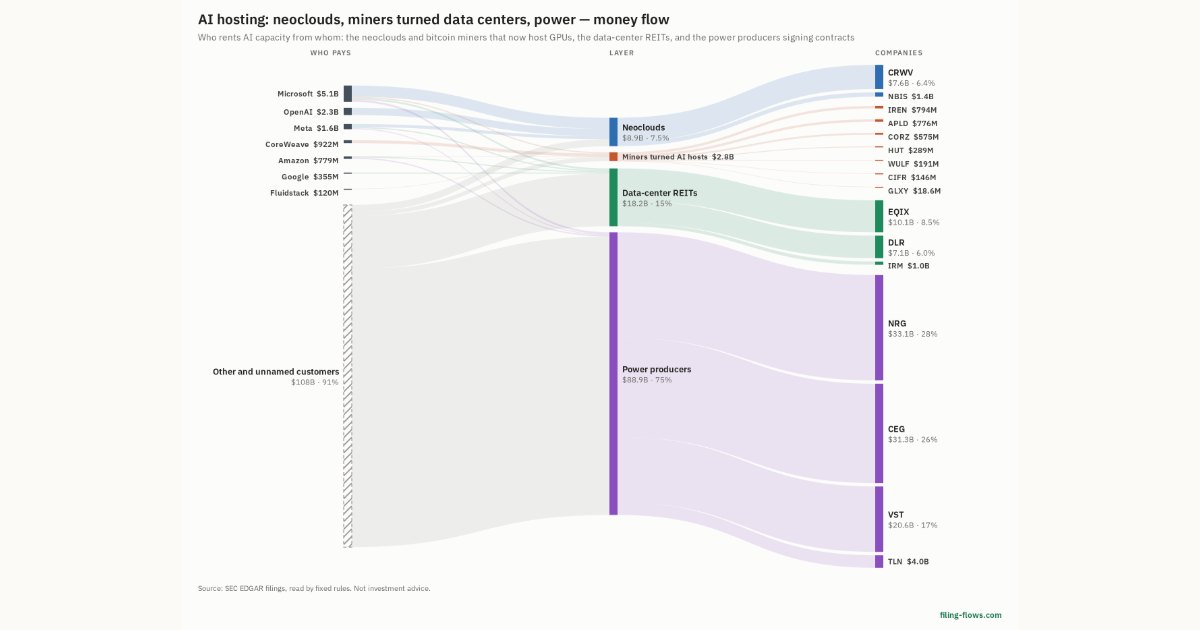 AI hosting: neoclouds, miners turned data centers, power · Power producers
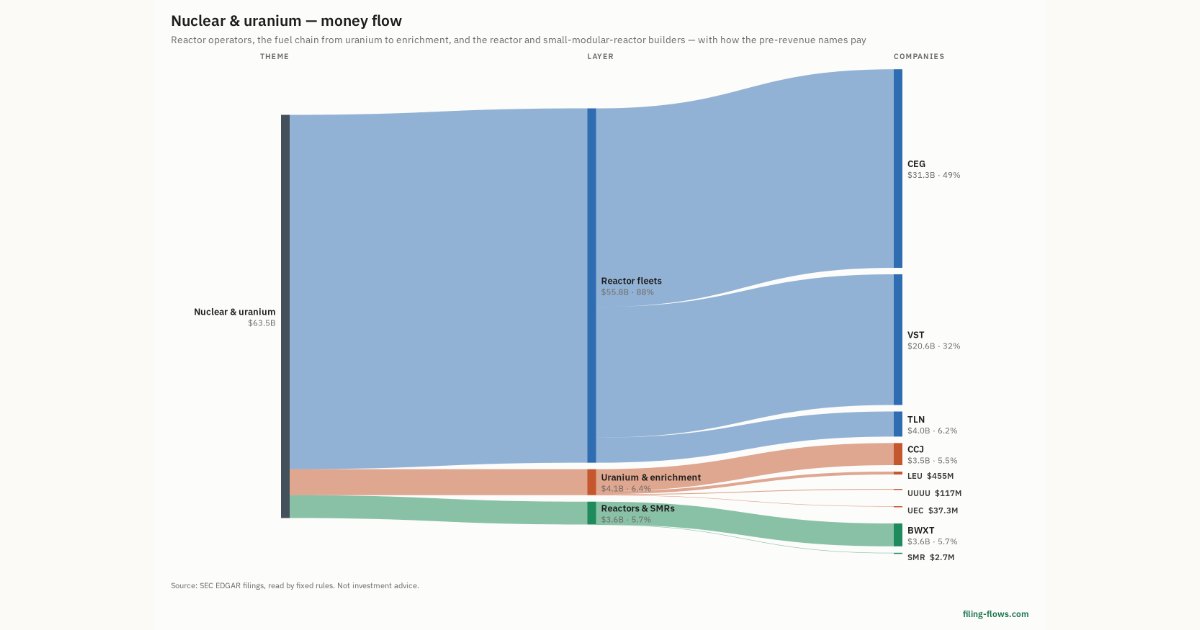 Nuclear & uranium · Reactor fleets
Interactive views
The same charts as the app — open one to draw it.
💵Where each $1 goesinteractive
Loading the interactive chart…
🌏Named in Asian annual reportsinteractive
Loading the interactive chart…
🔄Rotation against the market and its industry (RRG)interactive
Loading the interactive chart…
🔍Earnings qualityinteractive
Loading the interactive chart…
⚖️Fair value by methodinteractive
Loading the interactive chart…
🔭Outlook & guidanceinteractive
Loading the interactive chart…
📈Investments: gains and what it boughtinteractive
Loading the interactive chart…
🏭Its industry’s money flow (input-output)interactive
Loading the interactive chart…
About Vistra
References in this report to "we," "our," "us," and "the Company" are to Vistra and/or its subsidiaries, as apparent in the context. See Glossary of Terms and Abbreviations for defined terms. Vistra is an integrated retail electricity and power generation company that provides essential power resources to customers, businesses, and communities from California to Maine. We combine an innovative, customer-centric approach to retail sales with safe, reliable, diverse, and efficient power generation. Our integrated power generation and wholesale operation allows us to efficiently obtain the electricity needed to serve our customers at the lowest cost. The integrated model enables us to structure products and contracts in a way that offers significant value compared to stand-alone retail electric providers.
In its own words, from its 10-K, filed Feb 27, 2026.
Vistra against its Electric Services peers
The largest companies of the same SEC industry, each at its latest quarter. Revenue growth: +28% against the peers' median +13%. Operating margin: 26.9% against the peers' median 26.9%.
| Company | Quarter | Revenue | Y/Y | Op. margin |
|---|---|---|---|---|
| VST Vistra | Q3 2026 | $6.3B | +28% | 26.9% |
| Southern Power | Q3 2026 | $8.8B | +13% | 33.9% |
| NEE NextEra Energy | Q3 2026 | $8.1B | +2% | 32.4% |
| Florida Power & Light | Q2 2026 | $7.5B | +12% | 29.7% |
| CEG Constellation Energy | Q2 2026 | $7.5B | +23% | 7.7% |
| NRG NRG Energy | Q2 2026 | $7.5B | +11% | 13.0% |
| AEP Texas | Q3 2026 | $6.8B | +14% | 26.5% |
| D Dominion Energy | Q3 2026 | $5.6B | +24% | 32.8% |
| AEP American Electric Power | Q2 2026 | $5.4B | +7% | 22.9% |
Source: Vistra 8-K on SEC EDGAR · CIK 1692819 · Electric Services
13F: who owns VST and who is buying
More on VST
History
Every quarter: Q3 2026 results · Q2 2026 results · Q1 2026 results · Q4 2025 results · Q3 2025 results · Q2 2025 results · Q1 2025 results