Filing Flows › Utilities › AEP Texas
AEP Texas earnings and revenue breakdown
Latest: Q3 2026 · 10-Q filed Oct 28, 2026
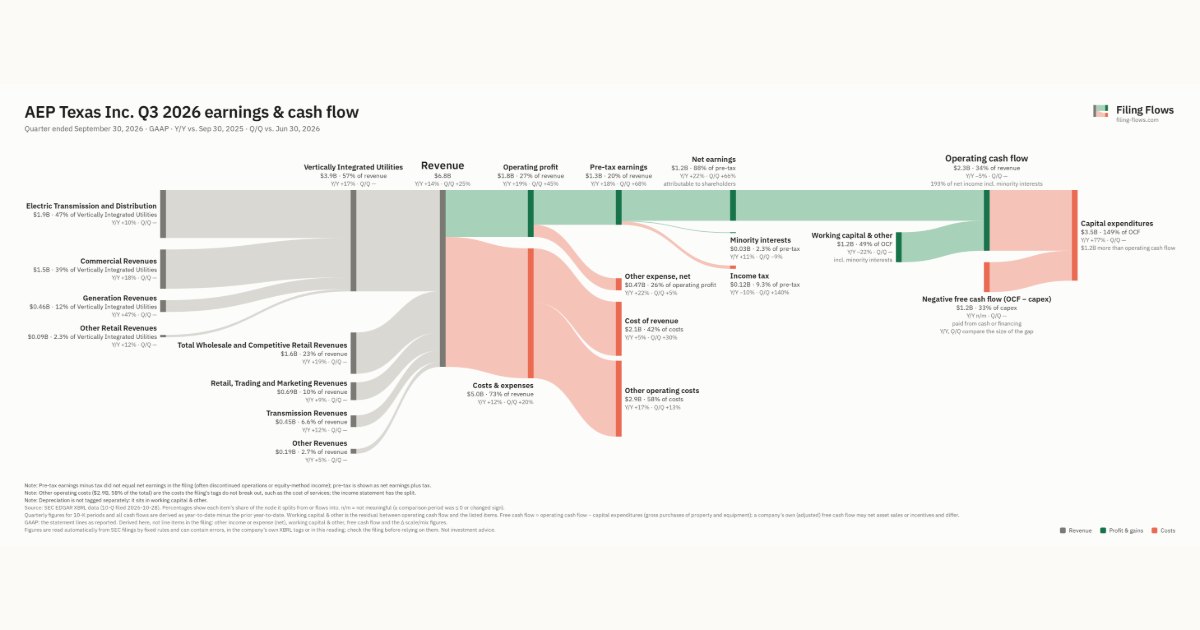
Q3 2026 Revenue up 14% year over year to $6.8B · 17¢ of every $1 of revenue kept as net profit · operating margin 26.5%
AEP Texas made $6.8B in Q3 2026 (+14% Y/Y): Vertically Integrated Utilities $3.9B, Total Wholesale and Competitive Retail Revenues $1.6B, Retail, Trading and Marketing Revenues $689M. Operating margin 26.5%, net earnings $1.2B. See where every dollar goes — costs, profit and cash — as a Sankey from the 10-Q filed Oct 28, 2026.
Drawing the Sankey…
Open the interactive Sankey → click any line for what the company wrote about it, compare Y/Y and Q/Q, export as PNG or PDF
What changed this quarter
Revenue was $6.8B in Q3 2026, up 14% year over year and up 25% from the previous quarter. Electric Transmission and Distribution was the largest line at 27% of revenue. Total Wholesale and Competitive Retail Revenues added $0.25B year over year (up 19%), 31% of the total change.
Operating profit was $1.8B, a 26.5% margin (up 1.2 points year over year). Of the extra revenue versus Q3 2025, 35% reached operating profit, above the 25% margin then. Total costs grew 12% against revenue growth of 14%. The fastest-growing cost line was Other operating costs (+17%). Net earnings were $1.2B, up 22% year over year. The effective tax rate was 9.3%.
Operating cash flow was $2.3B (down 5% year over year), 193% of net income including minority interests. Working capital and other items added $1.1B. Capital expenditures of $3.5B exceeded it, leaving free cash flow of −$1.2B.
Quarterly history
| Quarter | Form | Filed | Revenue | Y/Y | Op. margin | Net earnings | Op. cash flow |
|---|---|---|---|---|---|---|---|
| Q3 2026 | 10-Q | Oct 28, 2026 | $6.8B | +14% | 26.5% | $1.2B | $2.3B |
| Q2 2026 | 10-Q | Jul 30, 2026 | $5.4B | +7% | 22.9% | $713M | — |
| Q4 2025 | 10-K | Feb 12, 2026 | $5.3B | +13% | 21.0% | $582M | $1.8B |
| Q3 2025 | 10-Q | Oct 29, 2025 | $6.0B | +11% | 25.3% | $972M | $2.5B |
| Q2 2025 | 10-Q | Jul 30, 2025 | $5.1B | — | 27.5% | $1.2B | — |
Charts
Interactive views
The same charts as the app — open one to draw it.
💵Where each $1 goesinteractive
Loading the interactive chart…
🌏Named in Asian annual reportsinteractive
Loading the interactive chart…
🏭Its industry’s money flow (input-output)interactive
Loading the interactive chart…
Customers and suppliers named in filings
Sells to
- NRG Energy and Vistra Corp — 38% of its revenue · Stated in 10-K (XBRL) · source
About AEP Texas
AEP was incorporated under the laws of the State of New York in 1906 and reorganized in 1925. It is a public utility holding company that directly owns all of the outstanding common stock of the public utility subsidiaries identified below. The service areas of AEP’s public utility subsidiaries cover portions of the states of Arkansas, Indiana, Kentucky, Louisiana, Michigan, Ohio, Oklahoma, Tennessee, Texas, Virginia and West Virginia. Transmission networks are interconnected with extensive distribution facilities in the territories served. The public utility subsidiaries of AEP have traditionally provided electric service, consisting of generation, transmission and distribution, on an integrated basis to their retail customers.
In its own words, from its 10-K, filed Feb 12, 2026.
AEP Texas against its Electric Services peers
The largest companies of the same SEC industry, each at its latest quarter. Revenue growth: +14% against the peers' median +13%. Operating margin: 26.5% against the peers' median 26.9%.
| Company | Quarter | Revenue | Y/Y | Op. margin |
|---|---|---|---|---|
| AEP Texas | Q3 2026 | $6.8B | +14% | 26.5% |
| Southern Power | Q3 2026 | $8.8B | +13% | 33.9% |
| NEE NextEra Energy | Q3 2026 | $8.1B | +2% | 32.4% |
| Florida Power & Light | Q2 2026 | $7.5B | +12% | 29.7% |
| CEG Constellation Energy | Q2 2026 | $7.5B | +23% | 7.7% |
| NRG NRG Energy | Q2 2026 | $7.5B | +11% | 13.0% |
| VST Vistra | Q3 2026 | $6.3B | +28% | 26.9% |
| D Dominion Energy | Q3 2026 | $5.6B | +24% | 32.8% |
| AEP American Electric Power | Q2 2026 | $5.4B | +7% | 22.9% |
Source: AEP Texas 10-Q on SEC EDGAR · CIK 1721781 · Electric Services