Filing Flows › Utilities › Public Service Co of New Hampshire
Public Service Co of New Hampshire earnings and revenue breakdown
Latest: Q3 2026 · 10-Q filed Nov 6, 2026
Q3 2026 Revenue down 8% year over year to $3.0B · 12¢ of every $1 of revenue kept as net profit · operating margin 21.1%
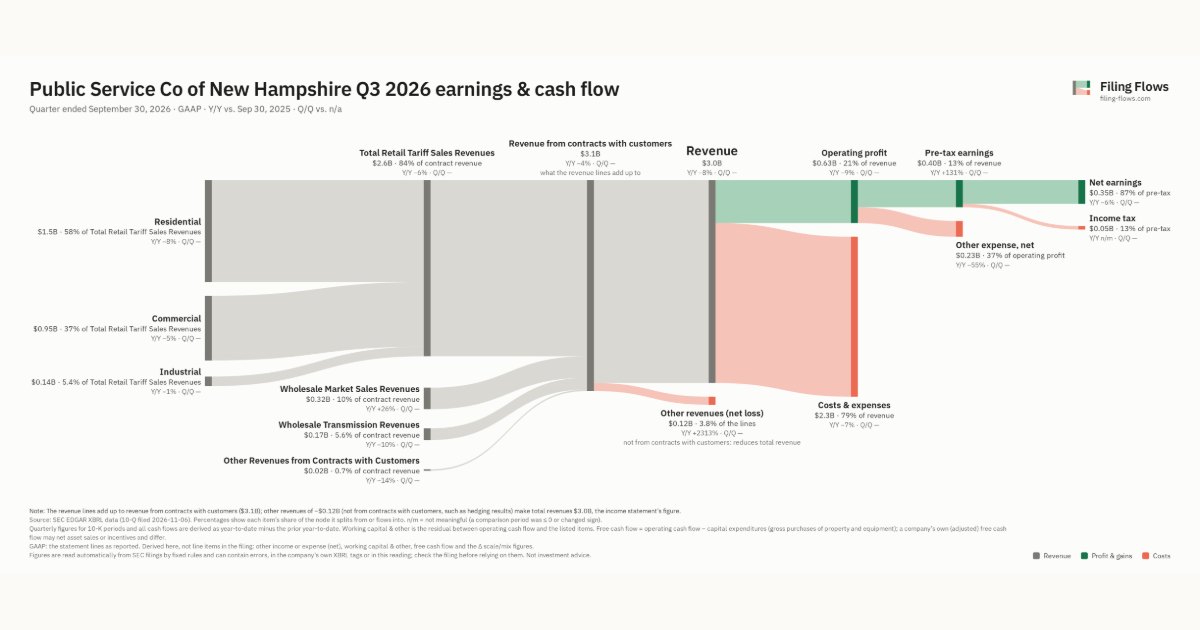
Public Service Co of New Hampshire made $3.0B in Q3 2026 (-8% Y/Y). Operating margin 21.1%, net earnings $348M. See where every dollar goes — costs, profit and cash — as a Sankey from the 10-Q filed Nov 6, 2026.
Drawing the Sankey…
Open the interactive Sankey → click any line for what the company wrote about it, compare Y/Y and Q/Q, export as PNG or PDF
What changed this quarter
Revenue was $3.0B in Q3 2026, down 8% year over year. Residential was the largest line at 50% of revenue. Residential lost $0.12B year over year (down 8%), 50% of the total change.
Operating profit was $0.63B, a 21.1% margin (down 0.2 points year over year). Total costs fell 7% while revenue fell 8%. Net earnings were $0.35B, down 6% year over year. The effective tax rate was 12.7%.
Operating cash flow was $0.65B (down 41% year over year), 188% of net earnings. Non-cash charges added back $0.26B of depreciation and amortization. Working capital and other items added $0.04B. Capital expenditures of $1.0B exceeded it, leaving free cash flow of −$0.38B.
Quarterly history
| Quarter | Form | Filed | Revenue | Y/Y | Op. margin | Net earnings | Op. cash flow |
|---|---|---|---|---|---|---|---|
| Q3 2026 | 10-Q | Nov 6, 2026 | $3.0B | -8% | 21.1% | $348M | $654M |
| Q2 2026 | 10-Q | Aug 3, 2026 | $2.9B | +2% | 18.6% | $55.6M | $1.1B |
| Q1 2026 | 10-Q | May 7, 2026 | $4.5B | +9% | 23.9% | $609M | $1.3B |
| Q3 2025 | 10-Q | Nov 6, 2025 | $3.2B | +5% | 21.4% | $369M | $1.1B |
| Q2 2025 | 10-Q | Aug 4, 2025 | $2.8B | +12% | 23.4% | $355M | $1.1B |
| Q1 2025 | 10-Q | May 5, 2025 | $4.1B | +24% | 22.5% | $553M | $1.0B |
Charts
Interactive views
The same charts as the app — open one to draw it.
💵Where each $1 goesinteractive
Loading the interactive chart…
🌏Named in Asian annual reportsinteractive
Loading the interactive chart…
🏭Its industry’s money flow (input-output)interactive
Loading the interactive chart…
About Public Service Co of New Hampshire
Please refer to the Glossary of Terms for definitions of defined terms and abbreviations used in this combined Annual Report on Form 10-K. Eversource Energy (Eversource), headquartered in Boston, Massachusetts and Hartford, Connecticut, is a public utility holding company subject to regulation by the Federal Energy Regulatory Commission (FERC) under the Public Utility Holding Company Act of 2005. We are engaged primarily in the energy delivery business through the following wholly-owned utility subsidiaries:
In its own words, from its 10-K, filed Feb 17, 2026.
Public Service Co of New Hampshire against its Electric Services peers
The largest companies of the same SEC industry, each at its latest quarter. Revenue growth: -8% against the peers' median +13%. Operating margin: 21.1% against the peers' median 26.9%.
| Company | Quarter | Revenue | Y/Y | Op. margin |
|---|---|---|---|---|
| Public Service Co of New Hampshire | Q3 2026 | $3.0B | -8% | 21.1% |
| Southern Power | Q3 2026 | $8.8B | +13% | 33.9% |
| NEE NextEra Energy | Q3 2026 | $8.1B | +2% | 32.4% |
| Florida Power & Light | Q2 2026 | $7.5B | +12% | 29.7% |
| CEG Constellation Energy | Q2 2026 | $7.5B | +23% | 7.7% |
| NRG NRG Energy | Q2 2026 | $7.5B | +11% | 13.0% |
| AEP Texas | Q3 2026 | $6.8B | +14% | 26.5% |
| VST Vistra | Q3 2026 | $6.3B | +28% | 26.9% |
| D Dominion Energy | Q3 2026 | $5.6B | +24% | 32.8% |
Source: Public Service Co of New Hampshire 10-Q on SEC EDGAR · CIK 315256 · Electric Services