Filing Flows › Industrials › United Airlines
United Airlines earnings and revenue breakdown
Latest: Q3 2026 · 10-Q filed Oct 21, 2026
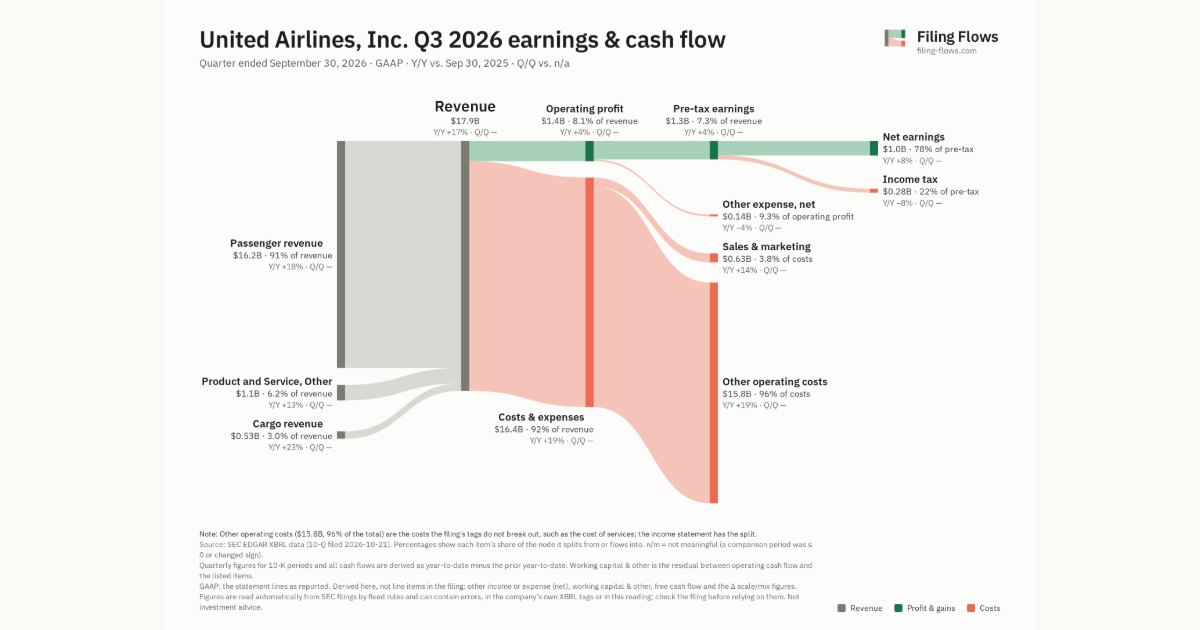
Q3 2026 Revenue up 17% year over year to $17.9B · 6¢ of every $1 of revenue kept as net profit · operating margin 8.1%
United Airlines made $17.9B in Q3 2026 (+17% Y/Y): Passenger revenue $16.2B, Product and Service, Other $1.1B, Cargo revenue $529M. Operating margin 8.1%, net earnings $1.0B. See where every dollar goes — costs, profit and cash — as a Sankey from the 10-Q filed Oct 21, 2026.
Drawing the Sankey…
Open the interactive Sankey → click any line for what the company wrote about it, compare Y/Y and Q/Q, export as PNG or PDF
What changed this quarter
Revenue was $17.9B in Q3 2026, up 17% year over year. Passenger revenue was the largest line at 91% of revenue. Passenger revenue added $2.4B year over year (up 18%), 92% of the total change.
Operating profit was $1.4B, a 8.1% margin (down 1.1 points year over year). Of the extra revenue versus Q3 2025, 2% reached operating profit, below the 9% margin then. Total costs grew 19% against revenue growth of 17%. The fastest-growing cost line was Other operating costs (+19%). Net earnings were $1.0B, up 8% year over year. The effective tax rate was 21.5%.
Operating cash flow was $0.47B (down 62% year over year), 45% of net earnings. Non-cash charges added back $0.78B of depreciation and amortization. Working capital and other items used $1.3B. Capital expenditures of $2.1B exceeded it, leaving free cash flow of −$1.7B.
Quarterly history
| Quarter | Form | Filed | Revenue | Y/Y | Op. margin | Net earnings | Op. cash flow |
|---|---|---|---|---|---|---|---|
| Q3 2026 | 10-Q | Oct 21, 2026 | $17.9B | +17% | 8.1% | $1.0B | $465M |
| Q2 2026 | 10-Q | Jul 16, 2026 | $17.7B | +16% | 6.2% | $805M | $1.6B |
| Q1 2026 | 10-Q | Apr 22, 2026 | $14.6B | +11% | 6.8% | $699M | $4.8B |
| Q4 2025 | 10-K | Feb 12, 2026 | $15.4B | +5% | 9.0% | $1.0B | $1.3B |
| Q3 2025 | 10-Q | Oct 16, 2025 | $15.2B | +3% | 9.2% | $949M | $1.2B |
| Q2 2025 | 10-Q | Jul 17, 2025 | $15.2B | +2% | 8.7% | $973M | $2.2B |
| Q1 2025 | 10-Q | Apr 16, 2025 | $13.2B | +5% | 4.6% | $387M | $3.7B |
Charts
Interactive views
The same charts as the app — open one to draw it.
💵Where each $1 goesinteractive
Loading the interactive chart…
🌏Named in Asian annual reportsinteractive
Loading the interactive chart…
🏭Its industry’s money flow (input-output)interactive
Loading the interactive chart…
About United Airlines
United Airlines Holdings, Inc. (together with its consolidated subsidiaries, "UAL" or the "Company") is a holding company and its wholly-owned subsidiary is United Airlines, Inc. (together with its consolidated subsidiaries, "United"). United's shared purpose is "Connecting People. Uniting the World." United has the most comprehensive route network among North American carriers, including U.S. mainland hubs in Chicago, Denver, Houston, Los Angeles, New York/Newark, San Francisco and Washington, D.C. As UAL consolidates United for financial statement purposes, disclosures that relate to activities of United also apply to UAL, unless otherwise noted. United's operating revenues and operating expenses comprise nearly 100% of UAL's revenues and operating expenses. In addition, United comprises approximately the entire balance of UAL's assets, liabilities and operating cash flows.
In its own words, from its 10-K, filed Feb 12, 2026.
United Airlines against its Air Transportation, Scheduled peers
The largest companies of the same SEC industry, each at its latest quarter. Revenue growth: +17% against the peers' median +19%. Operating margin: 8.1% against the peers' median 1.9%.
| Company | Quarter | Revenue | Y/Y | Op. margin |
|---|---|---|---|---|
| United Airlines | Q3 2026 | $17.9B | +17% | 8.1% |
| DAL Delta Air Lines | Q3 2026 | $20.2B | +21% | 7.2% |
| AAL American Airlines Group | Q3 2026 | $16.3B | +19% | 0.7% |
| American Airlines | Q1 2025 | $12.6B | -0.2% | -2.2% |
| LUV Southwest Airlines | Q3 2026 | $8.4B | +21% | 4.5% |
| ALK Alaska Air Group | Q3 2026 | $4.3B | +14% | 1.9% |
| JBLU Jetblue Airways | Q3 2026 | $2.8B | +21% | -5.1% |
| ULCC Frontier Group Holdings | Q3 2026 | $1.4B | +53% | -8.0% |
| SKYW Skywest | Q3 2026 | $1.1B | +6% | 15.8% |
Source: United Airlines 10-Q on SEC EDGAR · CIK 319687 · Air Transportation, Scheduled