Filing Flows › Industrials › American Airlines
American Airlines earnings and revenue breakdown
Latest: Q1 2025 · 10-Q filed Apr 24, 2025
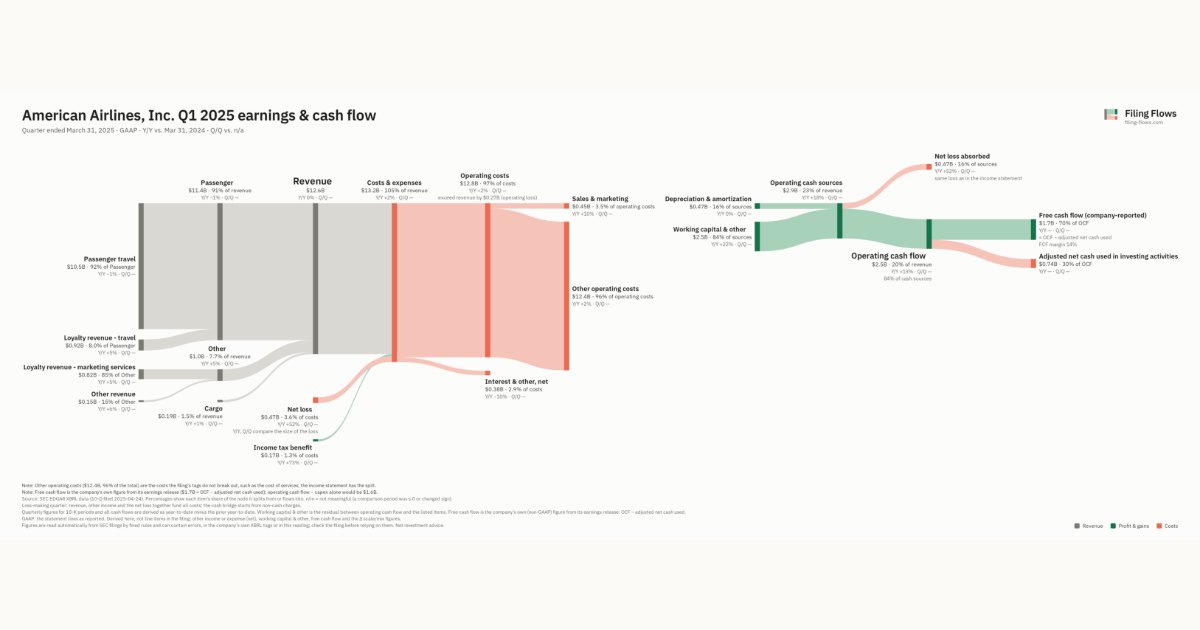
Q1 2025 Revenue down 0% year over year to $12.6B · 4¢ of every $1 of revenue lost · operating margin -2.2%
American Airlines made $12.6B in Q1 2025 (-0.2% Y/Y): Passenger $11.4B, Other $971M, Cargo $189M. Operating margin -2.2%, net loss $473M. See where every dollar goes — costs, profit and cash — as a Sankey from the 10-Q filed Apr 24, 2025.
Drawing the Sankey…
Open the interactive Sankey → click any line for what the company wrote about it, compare Y/Y and Q/Q, export as PNG or PDF
What changed this quarter
Revenue was $12.6B in Q1 2025, roughly flat year over year. Passenger travel was the largest line at 83% of revenue. Passenger travel lost $0.11B year over year (down 1%), 563% of the total change.
Operating costs exceeded revenue by $0.27B, an operating margin of -2.2%. Total costs grew 2% against flat revenue. The fastest-growing cost line was Sales & marketing (+10%). The quarter ended with a net loss of $0.47B. Net interest and other expense of $0.38B was the main reason.
Operating cash flow was $2.5B (up 13% year over year). Non-cash charges added back $0.47B of depreciation and amortization. Working capital and other items added $2.5B. After adjusted net cash used in investing activities ($0.74B), free cash flow as the company reports it was $1.7B.
Quarterly history
| Quarter | Form | Filed | Revenue | Y/Y | Op. margin | Net earnings | Op. cash flow |
|---|---|---|---|---|---|---|---|
| Q1 2025 | 10-Q | Apr 24, 2025 | $12.6B | -0.2% | -2.2% | −$473M | $2.5B |
Charts
Interactive views
The same charts as the app — open one to draw it.
💵Where each $1 goesinteractive
Loading the interactive chart…
🌏Named in Asian annual reportsinteractive
Loading the interactive chart…
🏭Its industry’s money flow (input-output)interactive
Loading the interactive chart…
About American Airlines
American Airlines Group Inc. (AAG), a Delaware corporation, is a holding company and its principal, wholly-owned subsidiaries are American Airlines, Inc. (American), Envoy Aviation Group Inc., PSA Airlines, Inc. (PSA) and Piedmont Airlines, Inc. (Piedmont). AAG was formed in 1982, under the name AMR Corporation (AMR), as the parent company of American, which was founded in 1934, with roots tracing back to an air mail carrier in the Midwestern United States in 1926. AAG’s and American’s principal executive offices are located at 1 Skyview Drive, Fort Worth, Texas 76155 and their telephone number is 682-278-9000.
In its own words, from its 10-K, filed Feb 18, 2026.
American Airlines against its Air Transportation, Scheduled peers
The largest companies of the same SEC industry, each at its latest quarter. Revenue growth: -0.2% against the peers' median +19%. Operating margin: -2.2% against the peers' median 1.9%.
| Company | Quarter | Revenue | Y/Y | Op. margin |
|---|---|---|---|---|
| American Airlines | Q1 2025 | $12.6B | -0.2% | -2.2% |
| DAL Delta Air Lines | Q3 2026 | $20.2B | +21% | 7.2% |
| United Airlines | Q3 2026 | $17.9B | +17% | 8.1% |
| AAL American Airlines Group | Q3 2026 | $16.3B | +19% | 0.7% |
| LUV Southwest Airlines | Q3 2026 | $8.4B | +21% | 4.5% |
| ALK Alaska Air Group | Q3 2026 | $4.3B | +14% | 1.9% |
| JBLU Jetblue Airways | Q3 2026 | $2.8B | +21% | -5.1% |
| ULCC Frontier Group Holdings | Q3 2026 | $1.4B | +53% | -8.0% |
| SKYW Skywest | Q3 2026 | $1.1B | +6% | 15.8% |
Source: American Airlines 10-Q on SEC EDGAR · CIK 4515 · Air Transportation, Scheduled