Filing Flows › Utilities › Evergy Kansas Central
Evergy Kansas Central earnings and revenue breakdown
Latest: Q2 2026 · 10-Q filed Aug 6, 2026
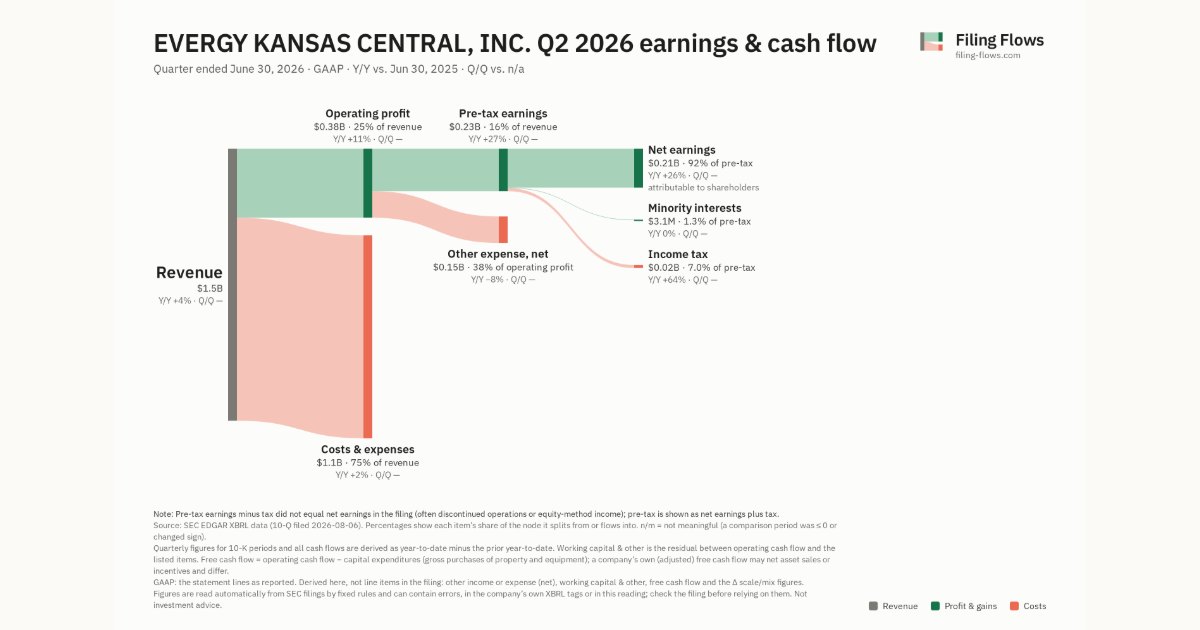
Q2 2026 Revenue up 4% year over year to $1.5B · 14¢ of every $1 of revenue kept as net profit · operating margin 25.4%
Evergy Kansas Central made $1.5B in Q2 2026 (+4% Y/Y). Operating margin 25.4%, net earnings $215M. See where every dollar goes — costs, profit and cash — as a Sankey from the 10-Q filed Aug 6, 2026.
Drawing the Sankey…
Open the interactive Sankey → click any line for what the company wrote about it, compare Y/Y and Q/Q, export as PNG or PDF
What changed this quarter
Revenue was $1.5B in Q2 2026, up 4% year over year.
Operating profit was $0.38B, a 25.4% margin (up 1.4 points year over year). Of the extra revenue versus Q2 2025, 58% reached operating profit, above the 24% margin then. Total costs grew 2% against revenue growth of 4%. Net earnings were $0.21B, up 26% year over year. The effective tax rate was 7.0%.
Quarterly history
| Quarter | Form | Filed | Revenue | Y/Y | Op. margin | Net earnings | Op. cash flow |
|---|---|---|---|---|---|---|---|
| Q2 2026 | 10-Q | Aug 6, 2026 | $1.5B | +4% | 25.4% | $215M | — |
| Q3 2025 | 10-Q | Nov 6, 2025 | $1.8B | -0.1% | 36.4% | $475M | $938M |
| Q2 2025 | 10-Q | Aug 7, 2025 | $1.4B | — | 23.9% | $171M | — |
Charts
Interactive views
The same charts as the app — open one to draw it.
💵Where each $1 goesinteractive
Loading the interactive chart…
🌏Named in Asian annual reportsinteractive
Loading the interactive chart…
🏭Its industry’s money flow (input-output)interactive
Loading the interactive chart…
About Evergy Kansas Central
Evergy, Inc., Evergy Kansas Central, Inc. and Evergy Metro, Inc. are separate registrants filing this combined annual report on Form 10-K. The terms "Evergy," "Evergy Kansas Central," "Evergy Metro" and "Evergy Companies" are used throughout this report. "Evergy" refers to Evergy, Inc. and its consolidated subsidiaries, unless otherwise indicated. "Evergy Kansas Central" refers to Evergy Kansas Central, Inc. and its consolidated subsidiaries, unless otherwise indicated. "Evergy Metro" refers to Evergy Metro, Inc. and its consolidated subsidiaries, unless otherwise indicated. "Evergy Companies" refers to Evergy, Evergy Kansas Central, and Evergy Metro, collectively, which are individual registrants within the Evergy consolidated group.
In its own words, from its 10-K, filed Feb 19, 2026.
Evergy Kansas Central against its Electric & Other Services Combined peers
The largest companies of the same SEC industry, each at its latest quarter. Revenue growth: +4% against the peers' median +7%. Operating margin: 25.4% against the peers' median 22.2%.
| Company | Quarter | Revenue | Y/Y | Op. margin |
|---|---|---|---|---|
| Evergy Kansas Central | Q2 2026 | $1.5B | +4% | 25.4% |
| DUK Duke Energy | Q3 2026 | $9.1B | +7% | 30.2% |
| Pepco Holdings LLC | Q3 2026 | $7.3B | +9% | 18.8% |
| EXC Exelon | Q1 2026 | $7.2B | +8% | 22.2% |
| PCG PG&E | Q3 2026 | $6.2B | -1% | 20.2% |
| ED Consolidated Edison | Q3 2026 | $4.9B | +8% | 23.8% |
| XEL Xcel Energy | Q3 2026 | $4.2B | +7% | 28.5% |
| Consolidated Edison Co of New York | Q2 2026 | $4.1B | +13% | 13.6% |
| PEG Public Service Enterprise Group | Q3 2026 | $3.0B | -6% | 20.6% |
Source: Evergy Kansas Central 10-Q on SEC EDGAR · CIK 54507 · Electric & Other Services Combined