Filing Flows › Utilities › Arizona Public Service
Arizona Public Service earnings and revenue breakdown
Latest: Q2 2026 · 10-Q filed Aug 4, 2026
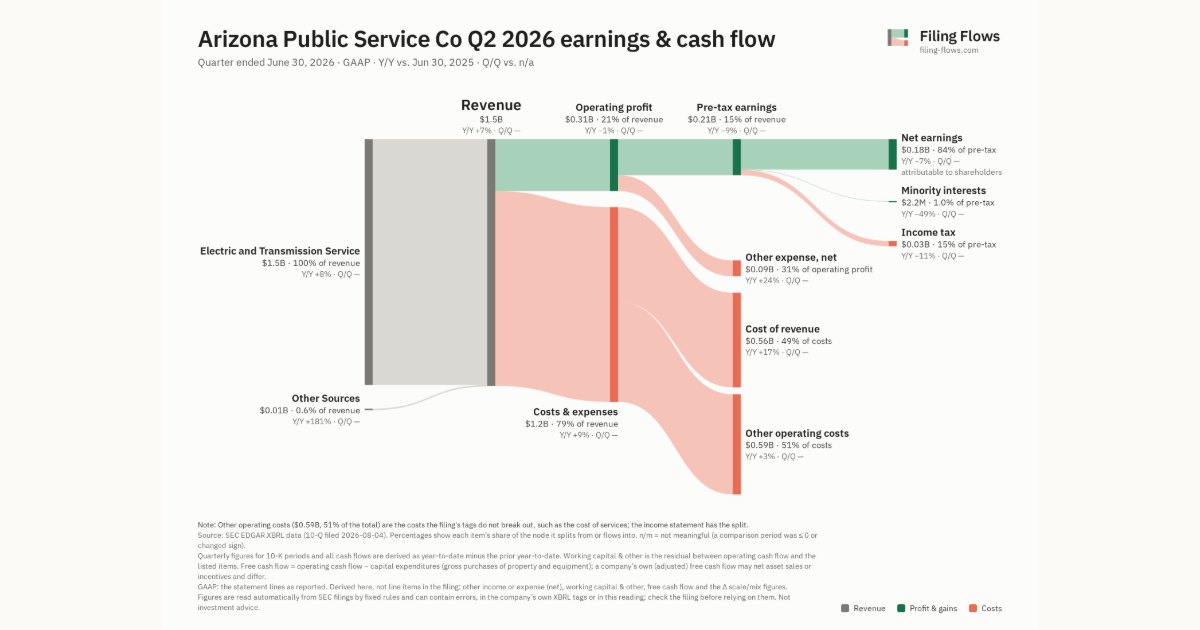
Q2 2026 Revenue up 7% year over year to $1.5B · 12¢ of every $1 of revenue kept as net profit · operating margin 21.0%
Arizona Public Service made $1.5B in Q2 2026 (+7% Y/Y): Electric and Transmission Service $1.5B, Other Sources $8.9M. Operating margin 21.0%, net earnings $179M. See where every dollar goes — costs, profit and cash — as a Sankey from the 10-Q filed Aug 4, 2026.
Drawing the Sankey…
Open the interactive Sankey → click any line for what the company wrote about it, compare Y/Y and Q/Q, export as PNG or PDF
What changed this quarter
Revenue was $1.5B in Q2 2026, up 7% year over year. Electric and Transmission Service was the largest line at 100% of revenue. Electric and Transmission Service added $0.11B year over year (up 8%), 109% of the total change.
Operating profit was $0.31B, a 21.0% margin (down 1.6 points year over year). Operating profit fell $1.9M even though revenue rose $0.10B versus Q2 2025, so costs grew faster than sales. Total costs grew 9% against revenue growth of 7%. The fastest-growing cost line was Cost of revenue (+17%). Net earnings were $0.18B, down 7% year over year. The effective tax rate was 14.8%.
Operating cash flow was $0.39B (up 51% year over year), 218% of net earnings. Non-cash charges added back $0.26B of depreciation and amortization and $4.6M of share-based compensation. Working capital and other items used $0.05B. Capital expenditures of $0.73B exceeded it, leaving free cash flow of −$0.33B.
Quarterly history
| Quarter | Form | Filed | Revenue | Y/Y | Op. margin | Net earnings | Op. cash flow |
|---|---|---|---|---|---|---|---|
| Q2 2026 | 10-Q | Aug 4, 2026 | $1.5B | +7% | 21.0% | $179M | $394M |
| Q1 2026 | 10-Q | May 4, 2026 | $1.1B | +11% | 11.4% | $32.9M | $235M |
| Q3 2025 | 10-Q | Nov 3, 2025 | $1.8B | +3% | 32.0% | $413M | $665M |
| Q2 2025 | 10-Q | Aug 6, 2025 | $1.4B | +4% | 22.6% | $193M | $261M |
| Q1 2025 | 10-Q | May 1, 2025 | $1.0B | +8% | 5.5% | −$338K | $402M |
Charts
Interactive views
The same charts as the app — open one to draw it.
💵Where each $1 goesinteractive
Loading the interactive chart…
🌏Named in Asian annual reportsinteractive
Loading the interactive chart…
🏭Its industry’s money flow (input-output)interactive
Loading the interactive chart…
About Arizona Public Service
with consolidated assets of approximately $30 billion. We derive essentially all of our revenues and earnings from our principal subsidiary, APS. Since 1886, APS and its affiliates have provided energy and energy-related products to people and businesses throughout Arizona. APS is Arizona’s largest and longest-serving electric company and generates safe, affordable electricity in 11 of Arizona’s 15 counties. Our other active subsidiaries are El Dorado and PNW Power. Our reportable business segment is our regulated electricity segment, which consists of traditional regulated retail and wholesale electricity businesses (primarily electric service to Native Load customers) and related activities, and includes electricity generation, transmission, and distribution. Our reportable business segment activities are conducted primarily through our wholly-owned subsidiary, APS.
In its own words, from its 10-K, filed Feb 25, 2026.
Arizona Public Service against its Electric & Other Services Combined peers
The largest companies of the same SEC industry, each at its latest quarter. Revenue growth: +7% against the peers' median +7%. Operating margin: 21.0% against the peers' median 21.0%.
| Company | Quarter | Revenue | Y/Y | Op. margin |
|---|---|---|---|---|
| Arizona Public Service | Q2 2026 | $1.5B | +7% | 21.0% |
| DUK Duke Energy | Q3 2026 | $9.1B | +7% | 30.2% |
| Pepco Holdings LLC | Q3 2026 | $7.3B | +9% | 18.8% |
| EXC Exelon | Q1 2026 | $7.2B | +8% | 22.2% |
| PCG PG&E | Q3 2026 | $6.2B | -1% | 20.2% |
| ED Consolidated Edison | Q3 2026 | $4.9B | +8% | 23.8% |
| XEL Xcel Energy | Q3 2026 | $4.2B | +7% | 28.5% |
| Consolidated Edison Co of New York | Q2 2026 | $4.1B | +13% | 13.6% |
| PEG Public Service Enterprise Group | Q3 2026 | $3.0B | -6% | 20.6% |
Source: Arizona Public Service 10-Q on SEC EDGAR · CIK 7286 · Electric & Other Services Combined