Filing Flows › Energy › Continental Resources
Continental Resources earnings and revenue breakdown
Latest: Q3 2026 · 10-Q filed Oct 30, 2026
Q3 2026 Revenue down 33% year over year to $1.4B · 5¢ of every $1 of revenue kept as net profit · operating margin 9.0%
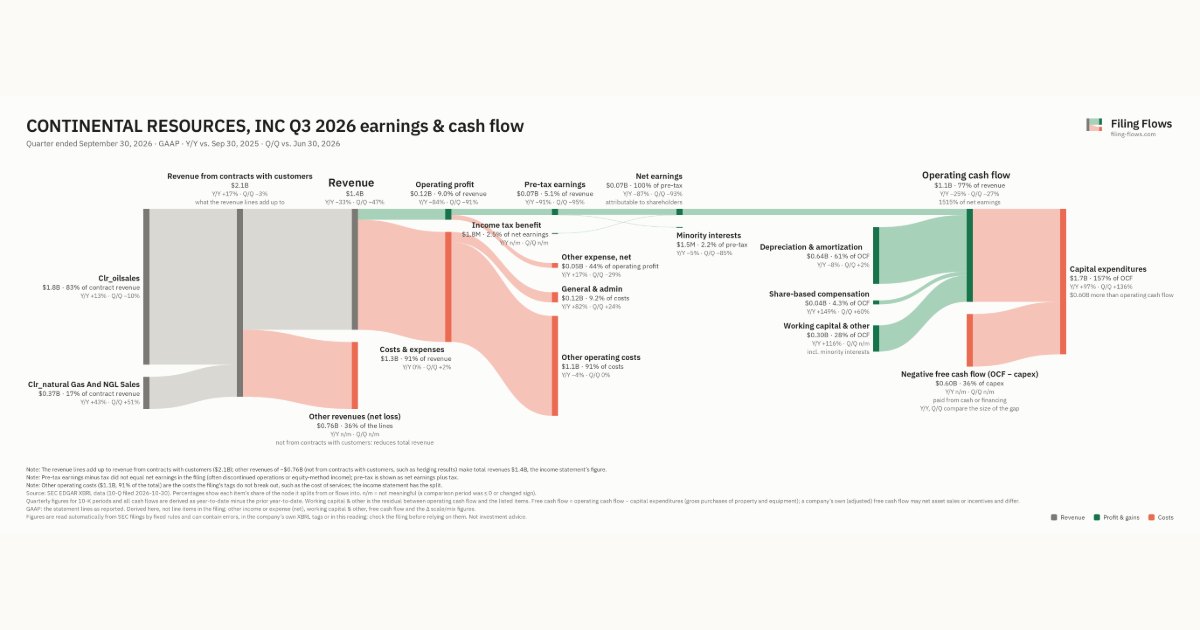
Continental Resources made $1.4B in Q3 2026 (-33% Y/Y). Operating margin 9.0%, net earnings $69.8M. See where every dollar goes — costs, profit and cash — as a Sankey from the 10-Q filed Oct 30, 2026.
Drawing the Sankey…
Open the interactive Sankey → click any line for what the company wrote about it, compare Y/Y and Q/Q, export as PNG or PDF
What changed this quarter
Revenue was $1.4B in Q3 2026, down 33% year over year and down 47% from the previous quarter. Oil sales was the largest line, $1.8B against total revenue of $1.4B (other lines net negative).
Operating profit was $0.12B, a 9.0% margin (down 29.7 points year over year). Total costs fell 0% while revenue fell 33%. The fastest-growing cost line was General & admin (+82%). Net earnings were $0.07B, down 87% year over year. The effective tax rate was -2.5%.
Operating cash flow was $1.1B (down 25% year over year), 1482% of net income including minority interests. Non-cash charges added back $0.64B of depreciation and amortization and $0.04B of share-based compensation. Working capital and other items added $0.30B. Capital expenditures of $1.7B exceeded it, leaving free cash flow of −$0.60B.
Quarterly history
| Quarter | Form | Filed | Revenue | Y/Y | Op. margin | Net earnings | Op. cash flow |
|---|---|---|---|---|---|---|---|
| Q3 2026 | 10-Q | Oct 30, 2026 | $1.4B | -33% | 9.0% | $69.8M | $1.1B |
| Q2 2026 | 10-Q | Jul 31, 2026 | $2.6B | +23% | 52.4% | $986M | $1.5B |
| Q1 2026 | 10-Q | May 11, 2026 | $778M | -52% | -64.0% | −$439M | $1.1B |
| Q4 2025 | 10-K | Feb 23, 2026 | $1.9B | +19% | 32.4% | $480M | $1.2B |
| Q3 2025 | 10-Q | Nov 4, 2025 | $2.0B | +2% | 38.7% | $556M | $1.4B |
| Q2 2025 | 10-Q | Aug 1, 2025 | $2.1B | +10% | 46.3% | $727M | $869M |
| Q1 2025 | 10-Q | May 2, 2025 | $1.6B | -12% | 29.2% | $316M | $1.4B |
Charts
Interactive views
The same charts as the app — open one to draw it.
💵Where each $1 goesinteractive
Loading the interactive chart…
🌏Named in Asian annual reportsinteractive
Loading the interactive chart…
🏭Its industry’s money flow (input-output)interactive
Loading the interactive chart…
About Continental Resources
We are an independent crude oil and natural gas company formed in 1967 engaged in the exploration, development, management, and production of crude oil and natural gas and associated products with properties primarily located in four leading basins in the United States – the Bakken field of North Dakota and Montana, the Anadarko Basin of Oklahoma, the Permian Basin of Texas, and the Powder River Basin of Wyoming. As of December 31, 2025, all of our operations were conducted onshore in the United States. In the first quarter of 2026, we expanded our operations internationally via the acquisition of assets within the Vaca Muerta shale play in Argentina's Neuquén Basin. At the time of this filing, our 2026 activities in Argentina have no production or revenues and represent an immaterial portion of our consolidated assets.
In its own words, from its 10-K, filed Feb 23, 2026.
Continental Resources against its Crude Petroleum & Natural Gas peers
The largest companies of the same SEC industry, each at its latest quarter. Revenue growth: -33% against the peers' median +46%. Operating margin: 9.0% against the peers' median 19.5%.
| Company | Quarter | Revenue | Y/Y | Op. margin |
|---|---|---|---|---|
| Continental Resources | Q3 2026 | $1.4B | -33% | 9.0% |
| EOG EOG Resources | Q3 2026 | $8.5B | +46% | 41.9% |
| OXY Occidental Petroleum | Q2 2026 | $8.1B | +53% | 48.5% |
| DVN Devon Energy | Q3 2026 | $6.9B | +58% | 18.3% |
| FANG Diamondback Energy | Q3 2026 | $5.4B | +38% | 46.0% |
| EXE Expand Energy | Q3 2026 | $3.3B | +11% | 19.5% |
| PARR PAR Pacific Holdings | Q3 2026 | $3.1B | +52% | 15.5% |
| OVV Ovintiv | Q3 2026 | $2.6B | +26% | 33.7% |
| SM SM Energy | Q3 2026 | $2.2B | +167% | 10.9% |
Source: Continental Resources 10-Q on SEC EDGAR · CIK 732834 · Crude Petroleum & Natural Gas