Filing Flows › Financials › Jones Financial Companies Lllp
Jones Financial Companies Lllp earnings and revenue breakdown
Latest: Q3 2026 · 10-Q filed Nov 5, 2026
Q3 2026 Revenue up 13% year over year to $5.2B · 0¢ of every $1 of revenue kept as net profit · operating margin 0.0%
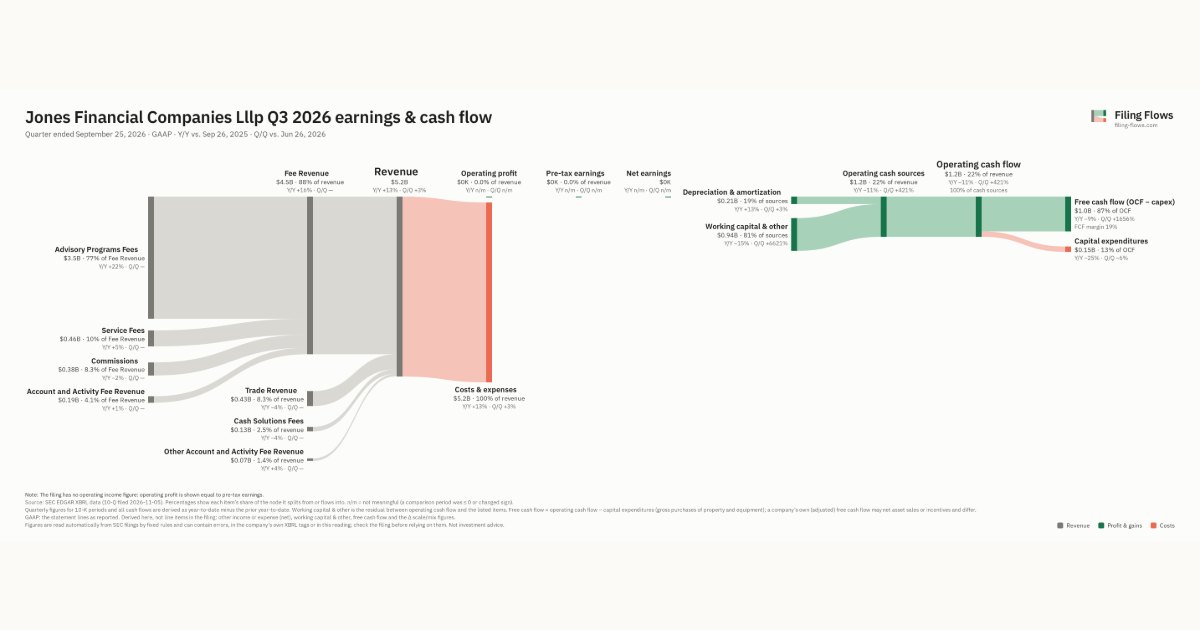
Jones Financial Companies Lllp made $5.2B in Q3 2026 (+13% Y/Y): Fee Revenue $4.5B, Trade Revenue $430M, Cash Solutions Fees $129M. Operating margin 0.0%, net earnings $0. See where every dollar goes — costs, profit and cash — as a Sankey from the 10-Q filed Nov 5, 2026.
Drawing the Sankey…
Open the interactive Sankey → click any line for what the company wrote about it, compare Y/Y and Q/Q, export as PNG or PDF
What changed this quarter
Revenue was $5.2B in Q3 2026, up 13% year over year and up 3% from the previous quarter. Advisory Programs Fees was the largest line at 68% of revenue. Advisory Programs Fees added $0.62B year over year (up 22%), 107% of the total change. Cash Solutions Fees declined 4%.
Operating profit was $0K, a 0.0% margin (unchanged year over year). Total costs grew 13% against revenue growth of 13%. Net earnings were $0K.
Operating cash flow was $1.2B (down 11% year over year). Non-cash charges added back $0.21B of depreciation and amortization. Working capital and other items added $0.94B. Capital expenditures of $0.15B left free cash flow of $1.0B.
Quarterly history
| Quarter | Form | Filed | Revenue | Y/Y | Op. margin | Net earnings | Op. cash flow |
|---|---|---|---|---|---|---|---|
| Q3 2026 | 10-Q | Nov 5, 2026 | $5.2B | +13% | 0.0% | $0 | $1.2B |
| Q2 2026 | 10-Q | Aug 7, 2026 | $5.0B | +18% | 0.0% | $0 | $222M |
| Q1 2026 | 10-Q | May 7, 2026 | $4.7B | +12% | 0.0% | $0 | −$735M |
| Q4 2025 | 10-K | Mar 13, 2026 | $4.8B | +13% | 0.0% | $0 | $1.2B |
| Q3 2025 | 10-Q | Nov 7, 2025 | $4.6B | +10% | 0.0% | $0 | $1.3B |
| Q2 2025 | 10-Q | Aug 8, 2025 | $4.3B | +8% | 0.0% | $0 | $1.9B |
| Q1 2025 | 10-Q | May 9, 2025 | $4.2B | +9% | 0.0% | $0 | $96.0M |
Charts
Interactive views
The same charts as the app — open one to draw it.
💵Where each $1 goesinteractive
Loading the interactive chart…
🌏Named in Asian annual reportsinteractive
Loading the interactive chart…
🏭Its industry’s money flow (input-output)interactive
Loading the interactive chart…
About Jones Financial Companies Lllp
and initial operations of Edward Jones Bank. For information on material risks related to Edward Jones Bank, refer to Part I, Item 1A – Risk Factors – Risks Related to Legal and Regulatory Matters – Bank Application Approval. The Partnership files annual, quarterly, and current reports and other information with the SEC. The Partnership’s SEC filings are available to the public on the SEC’s website at www.sec.gov and on our website at www.edwardjones.com .
In its own words, from its 10-K, filed Mar 13, 2026.
Jones Financial Companies Lllp against its Security Brokers, Dealers & Flotation Companies peers
The largest companies of the same SEC industry, each at its latest quarter. Revenue growth: +13% against the peers' median +13%. Operating margin: 0.0% against the peers' median 30.0%.
| Company | Quarter | Revenue | Y/Y | Op. margin |
|---|---|---|---|---|
| Jones Financial Companies Lllp | Q3 2026 | $5.2B | +13% | 0.0% |
| MS Morgan Stanley | Q3 2026 | $20.3B | +12% | 31.9% |
| GS Goldman Sachs Group | Q3 2026 | $18.7B | +23% | 37.5% |
| GLXY Galaxy Digital | Q3 2026 | $8.1B | -72% | 4.3% |
| BLK BlackRock | Q3 2026 | $7.8B | +19% | 30.0% |
| SCHW Schwab Charles | Q3 2026 | $7.2B | +17% | 52.7% |
| RJF Raymond James Financial | Q4 FY26 | $4.7B | +13% | 18.2% |
| JEF Jefferies Financial Group | Q3 FY26 | $3.2B | +11% | 10.9% |
| IBKR Interactive Brokers Group | Q3 2026 | $1.9B | +16% | 78.2% |
Source: Jones Financial Companies Lllp 10-Q on SEC EDGAR · CIK 815917 · Security Brokers, Dealers & Flotation Companies