Filing Flows › Financials › Jefferies Financial Group (JEF)
Jefferies Financial Group (JEF) earnings and revenue breakdown
Latest: Q3 FY26 · 10-Q filed Oct 9, 2026 · Jefferies Financial Group (JEF) Q3 FY26 earnings results →
Q3 FY26 Revenue up 11% year over year to $3.2B · 9¢ of every $1 of revenue kept as net profit · operating margin 10.9%
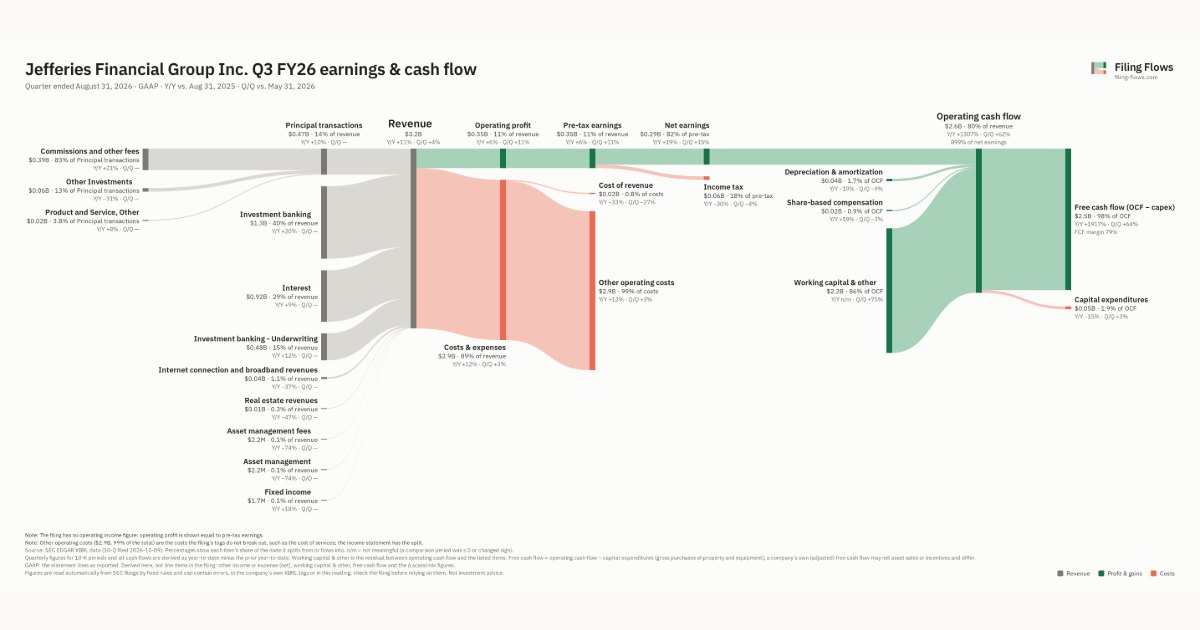
Jefferies Financial Group made $3.2B in Q3 FY26 (+11% Y/Y): Investment banking $1.3B, Interest $923M, Investment banking - Underwriting $483M. Operating margin 10.9%, net earnings $288M. See where every dollar goes — costs, profit and cash — as a Sankey from the 10-Q filed Oct 9, 2026.
Drawing the Sankey…
Open the interactive Sankey → click any line for what the company wrote about it, compare Y/Y and Q/Q, export as PNG or PDF
What changed this quarter
Revenue was $3.2B in Q3 FY26, up 11% year over year and up 4% from the previous quarter. Investment banking was the largest line at 40% of revenue. Investment banking added $0.21B year over year (up 20%), 66% of the total change. Asset management fees declined 74%.
Operating profit was $0.35B, a 10.9% margin (down 0.5 points year over year). Of the extra revenue versus Q3 FY25, 6% reached operating profit, below the 11% margin then. Total costs grew 12% against revenue growth of 11%. The fastest-growing cost line was Other operating costs (+12%). Net earnings were $0.29B, up 29% year over year. The effective tax rate was 17.9%.
Operating cash flow was $2.6B (up 1307% year over year), 899% of net earnings. Non-cash charges added back $0.04B of depreciation and amortization and $0.02B of share-based compensation. Working capital and other items added $2.2B. Capital expenditures of $0.05B left free cash flow of $2.5B.
Quarterly history
| Quarter | Form | Filed | Revenue | Y/Y | Op. margin | Net earnings | Op. cash flow |
|---|---|---|---|---|---|---|---|
| Q3 FY26 | 10-Q | Oct 9, 2026 | $3.2B | +11% | 10.9% | $288M | $2.6B |
| Q2 FY26 | 10-Q | Jul 9, 2026 | $3.1B | +25% | 10.1% | $250M | $1.6B |
| Q1 FY26 | 10-Q | Apr 7, 2026 | $2.9B | +16% | 7.4% | $159M | −$1.7B |
| Q4 FY25 | 10-K | Jan 28, 2026 | $2.9B | +3% | 8.4% | $191M | $2.0B |
| Q3 FY25 | 10-Q | Oct 9, 2025 | $2.9B | +12% | 11.4% | $224M | $184M |
Charts
Interactive views
The same charts as the app — open one to draw it.
💵Where each $1 goesinteractive
Loading the interactive chart…
🌏Named in Asian annual reportsinteractive
Loading the interactive chart…
🔄Rotation against the market and its industry (RRG)interactive
Loading the interactive chart…
🔍Earnings qualityinteractive
Loading the interactive chart…
⚖️Fair value by methodinteractive
Loading the interactive chart…
🔭Outlook & guidanceinteractive
Loading the interactive chart…
📈Investments: gains and what it boughtinteractive
Loading the interactive chart…
🏭Its industry’s money flow (input-output)interactive
Loading the interactive chart…
About Jefferies Financial Group
Jefferies Financial Group Inc. is a U.S.-headquartered global investment banking and capital markets firm. The accompanying consolidated financial statements represent the accounts of Jefferies Financial Group Inc. and subsidiaries (together, the “Company,” “we” or “us”). We, collectively with our consolidated subsidiaries and through our affiliates, deliver a broad range of financial services across investment banking, capital markets and asset management. We operate in two reportable business segments: (1) Investment Banking and Capital Markets and (2) Asset Management. The Investment Banking and Capital Markets reportable business segment includes our capital markets activities and our investment banking business, which provides underwriting and financial advisory services to our clients. We operate in the Americas; Europe and the Middle East; and Asia-Pacific.
In its own words, from its 10-Q, filed Oct 9, 2026.
Jefferies Financial Group against its Security Brokers, Dealers & Flotation Companies peers
The largest companies of the same SEC industry, each at its latest quarter. Revenue growth: +11% against the peers' median +13%. Operating margin: 10.9% against the peers' median 30.0%.
| Company | Quarter | Revenue | Y/Y | Op. margin |
|---|---|---|---|---|
| JEF Jefferies Financial Group | Q3 FY26 | $3.2B | +11% | 10.9% |
| MS Morgan Stanley | Q3 2026 | $20.3B | +12% | 31.9% |
| GS Goldman Sachs Group | Q3 2026 | $18.7B | +23% | 37.5% |
| GLXY Galaxy Digital | Q3 2026 | $8.1B | -72% | 4.3% |
| BLK BlackRock | Q3 2026 | $7.8B | +19% | 30.0% |
| SCHW Schwab Charles | Q3 2026 | $7.2B | +17% | 52.7% |
| Jones Financial Companies Lllp | Q3 2026 | $5.2B | +13% | 0.0% |
| RJF Raymond James Financial | Q4 FY26 | $4.7B | +13% | 18.2% |
| IBKR Interactive Brokers Group | Q3 2026 | $1.9B | +16% | 78.2% |
Source: Jefferies Financial Group 10-Q on SEC EDGAR · CIK 96223 · Security Brokers, Dealers & Flotation Companies
13F: who owns JEF and who is buying
More on JEF
History
Every quarter: Q3 FY26 results · Q2 FY26 results · Q1 FY26 results · Q4 FY25 results · Q3 FY25 results
- Jefferies Financial Group operating margin by quarter
- Jefferies Financial Group net income by quarter
- Jefferies Financial Group free cash flow by quarter
- Jefferies Financial Group capital expenditures by quarter
- Jefferies Financial Group Investment banking revenue by quarter
- Jefferies Financial Group Investment banking - Underwriting revenue by quarter