Filing Flows › Financials › Schwab Charles (SCHW)
Schwab Charles (SCHW) earnings and revenue breakdown
Latest: Q3 2026 · 10-Q filed Nov 6, 2026 · Schwab Charles (SCHW) Q3 2026 earnings results →
Q3 2026 Revenue up 17% year over year to $7.2B · 41¢ of every $1 of revenue kept as net profit · operating margin 52.7%
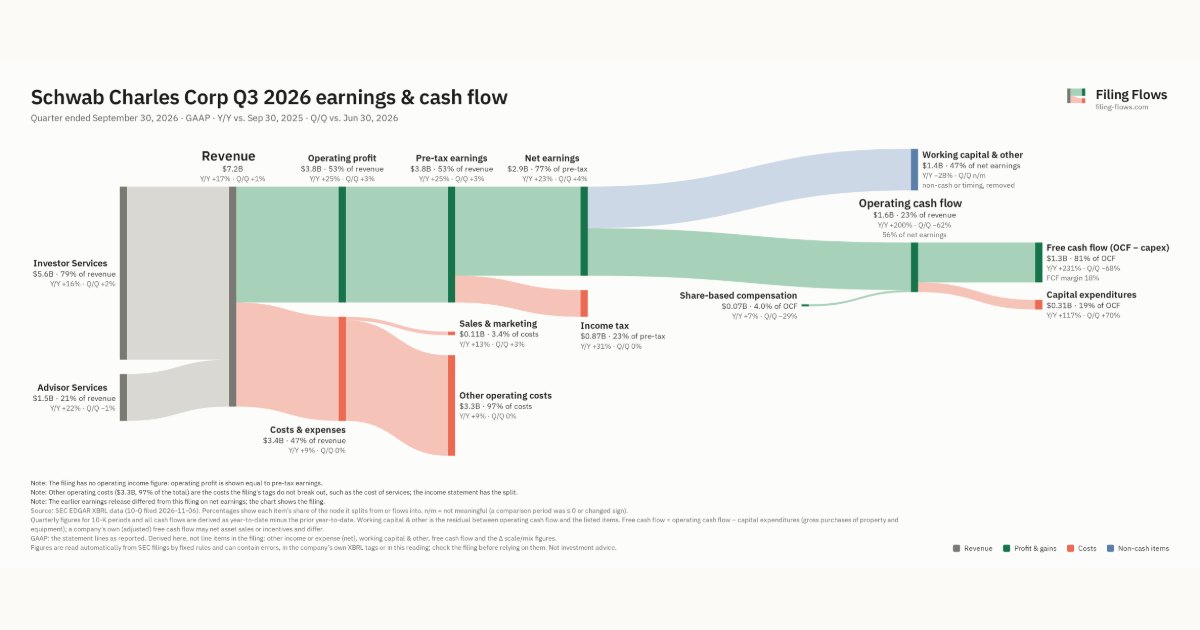
Schwab Charles made $7.2B in Q3 2026 (+17% Y/Y): Investor Services $5.6B, Advisor Services $1.5B. Operating margin 52.7%, net earnings $2.9B. See where every dollar goes — costs, profit and cash — as a Sankey from the 10-Q filed Nov 6, 2026.
Drawing the Sankey…
Open the interactive Sankey → click any line for what the company wrote about it, compare Y/Y and Q/Q, export as PNG or PDF
What changed this quarter
Revenue was $7.2B in Q3 2026, up 17% year over year and up 1% from the previous quarter. Investor Services was the largest line at 79% of revenue. Investor Services added $0.76B year over year (up 16%), 73% of the total change.
Operating profit was $3.8B, a 52.7% margin (up 3.4 points year over year). Of the extra revenue versus Q3 2025, 73% reached operating profit, above the 49% margin then. Total costs grew 9% against revenue growth of 17%. The fastest-growing cost line was Sales & marketing (+13%). Net earnings were $2.9B, up 23% year over year. The effective tax rate was 23.1%.
Operating cash flow was $1.6B (up 200% year over year), 56% of net earnings. Non-cash charges added back $0.07B of share-based compensation. Working capital and other items used $1.4B. Capital expenditures of $0.31B left free cash flow of $1.3B.
Quarterly history
| Quarter | Form | Filed | Revenue | Y/Y | Op. margin | Net earnings | Op. cash flow |
|---|---|---|---|---|---|---|---|
| Q3 2026 | 10-Q | Nov 6, 2026 | $7.2B | +17% | 52.7% | $2.9B | $1.6B |
| Q2 2026 | 10-Q | Aug 7, 2026 | $7.1B | +21% | 51.9% | $2.8B | $4.3B |
| Q1 2026 | 10-Q | May 8, 2026 | $6.5B | +16% | 49.2% | $2.5B | $7.3B |
| Q4 2025 | 10-K | Feb 25, 2026 | $6.3B | +19% | 50.2% | $2.5B | −$763M |
| Q3 2025 | 10-Q | Nov 7, 2025 | $6.1B | +27% | 49.2% | $2.4B | $538M |
| Q2 2025 | 10-Q | Aug 8, 2025 | $5.9B | +25% | 47.9% | $2.1B | $3.2B |
| Q1 2025 | 10-Q | May 9, 2025 | $5.6B | +18% | 43.8% | $1.9B | $6.4B |
Charts
Interactive views
The same charts as the app — open one to draw it.
💵Where each $1 goesinteractive
Loading the interactive chart…
🌏Named in Asian annual reportsinteractive
Loading the interactive chart…
🔄Rotation against the market and its industry (RRG)interactive
Loading the interactive chart…
🔍Earnings qualityinteractive
Loading the interactive chart…
⚖️Fair value by methodinteractive
Loading the interactive chart…
🔭Outlook & guidanceinteractive
Loading the interactive chart…
📈Investments: gains and what it boughtinteractive
Loading the interactive chart…
🏭Its industry’s money flow (input-output)interactive
Loading the interactive chart…
About Schwab Charles
The Charles Schwab Corporation (CSC) is a savings and loan holding company. CSC engages, through its subsidiaries (collectively referred to as Schwab or the Company), in wealth management, securities brokerage, banking, asset management, custody, and financial advisory services. At December 31, 2025, Schwab had $11.90 trillion in client assets, 38.5 million active brokerage accounts, 5.7 million workplace plan participant accounts, and 2.2 million banking accounts. • Charles Schwab Investment Management, Inc. (CSIM), the investment advisor for Schwab’s proprietary mutual funds (Schwab Funds ® ) and for Schwab’s exchange-traded funds (Schwab ETFs).
In its own words, from its 10-K, filed Feb 25, 2026.
Schwab Charles against its Security Brokers, Dealers & Flotation Companies peers
The largest companies of the same SEC industry, each at its latest quarter. Revenue growth: +17% against the peers' median +13%. Operating margin: 52.7% against the peers' median 30.0%.
| Company | Quarter | Revenue | Y/Y | Op. margin |
|---|---|---|---|---|
| SCHW Schwab Charles | Q3 2026 | $7.2B | +17% | 52.7% |
| MS Morgan Stanley | Q3 2026 | $20.3B | +12% | 31.9% |
| GS Goldman Sachs Group | Q3 2026 | $18.7B | +23% | 37.5% |
| GLXY Galaxy Digital | Q3 2026 | $8.1B | -72% | 4.3% |
| BLK BlackRock | Q3 2026 | $7.8B | +19% | 30.0% |
| Jones Financial Companies Lllp | Q3 2026 | $5.2B | +13% | 0.0% |
| RJF Raymond James Financial | Q4 FY26 | $4.7B | +13% | 18.2% |
| JEF Jefferies Financial Group | Q3 FY26 | $3.2B | +11% | 10.9% |
| IBKR Interactive Brokers Group | Q3 2026 | $1.9B | +16% | 78.2% |
Source: Schwab Charles 10-Q on SEC EDGAR · CIK 316709 · Security Brokers, Dealers & Flotation Companies
Guidance and outlook
13F: who owns SCHW and who is buying
More on SCHW
History
Every quarter: Q3 2026 results · Q2 2026 results · Q1 2026 results · Q4 2025 results · Q3 2025 results · Q2 2025 results · Q1 2025 results