Filing Flows › Industrials › Burlington Northern Santa FE, LLC
Burlington Northern Santa FE, LLC earnings and revenue breakdown
Latest: Q2 2026 · 10-Q filed Aug 10, 2026
Q2 2026 Revenue up 14% year over year to $6.6B · 24¢ of every $1 of revenue kept as net profit · operating margin 34.5%
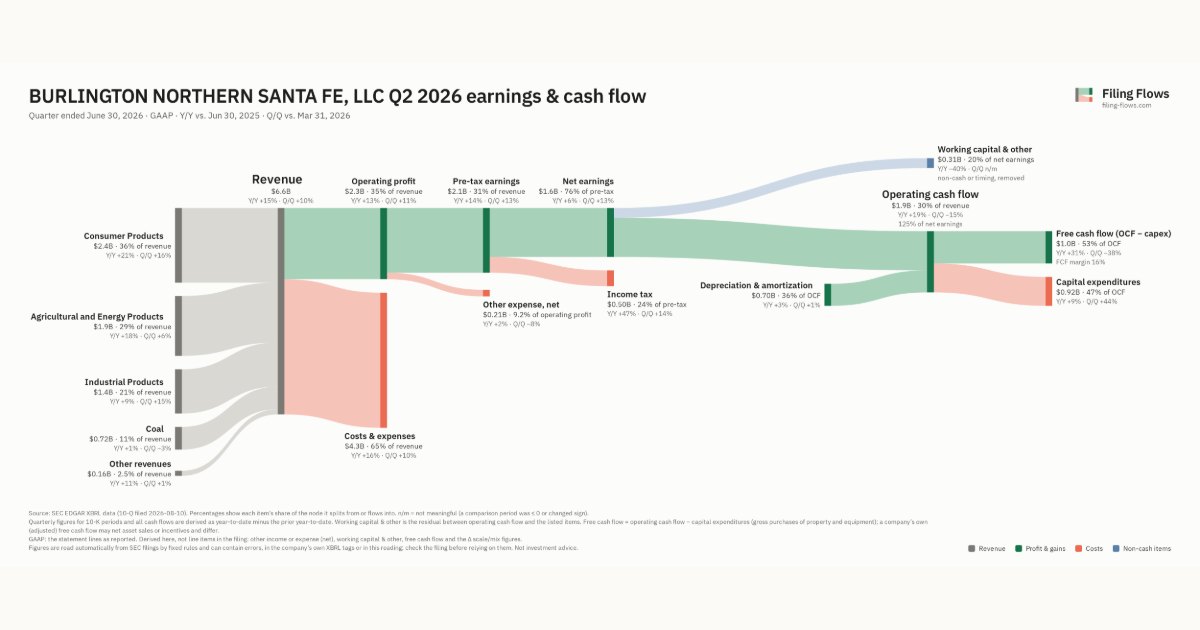
Burlington Northern Santa FE, LLC made $6.6B in Q2 2026 (+14% Y/Y): Consumer Products $2.4B, Agricultural and Energy Products $1.9B, Industrial Products $1.4B. Operating margin 34.5%, net earnings $1.6B. See where every dollar goes — costs, profit and cash — as a Sankey from the 10-Q filed Aug 10, 2026.
Drawing the Sankey…
Open the interactive Sankey → click any line for what the company wrote about it, compare Y/Y and Q/Q, export as PNG or PDF
What changed this quarter
Revenue was $6.6B in Q2 2026, up 15% year over year and up 10% from the previous quarter. Consumer Products was the largest line at 36% of revenue. Consumer Products added $0.41B year over year (up 21%), 49% of the total change.
Operating profit was $2.3B, a 34.5% margin (down 0.5 points year over year). Of the extra revenue versus Q2 2025, 31% reached operating profit, below the 35% margin then. Total costs grew 16% against revenue growth of 15%. Net earnings were $1.6B, up 6% year over year. The effective tax rate was 24.4%.
Operating cash flow was $1.9B (up 19% year over year), 125% of net earnings. Non-cash charges added back $0.70B of depreciation and amortization. Working capital and other items used $0.31B. Capital expenditures of $0.92B left free cash flow of $1.0B.
Quarterly history
| Quarter | Form | Filed | Revenue | Y/Y | Op. margin | Net earnings | Op. cash flow |
|---|---|---|---|---|---|---|---|
| Q2 2026 | 10-Q | Aug 10, 2026 | $6.6B | +14% | 34.5% | $1.6B | $1.9B |
| Q1 2026 | 10-Q | May 4, 2026 | $6.0B | +5% | 34.3% | $1.4B | $2.3B |
| Q4 2025 | 10-K | Mar 2, 2026 | $6.0B | -3% | 34.7% | $1.3B | $2.3B |
| Q3 2025 | 10-Q | Nov 3, 2025 | $6.0B | +2% | 35.7% | $1.4B | $2.3B |
| Q2 2025 | 10-Q | Aug 4, 2025 | $5.7B | +0.1% | 35.1% | $1.5B | $1.6B |
| Q1 2025 | 10-Q | May 5, 2025 | $5.7B | +0.6% | 32.0% | $1.2B | $1.9B |
| Q4 2024 | 10-K | Feb 24, 2025 | $6.1B | -0.8% | 30.6% | $1.3B | $2.1B |
Charts
Interactive views
The same charts as the app — open one to draw it.
💵Where each $1 goesinteractive
Loading the interactive chart…
🌏Named in Asian annual reportsinteractive
Loading the interactive chart…
🏭Its industry’s money flow (input-output)interactive
Loading the interactive chart…
About Burlington Northern Santa FE, LLC
Burlington Northern Santa Fe Corporation was incorporated in the State of Delaware on December 16, 1994. On February 12, 2010, Berkshire Hathaway Inc., a Delaware corporation (Berkshire), acquired 100% of the outstanding shares of Burlington Northern Santa Fe Corporation common stock that it did not already own. The acquisition was completed through the merger (Merger) of a Berkshire wholly-owned merger subsidiary and Burlington Northern Santa Fe Corporation with the surviving entity renamed Burlington Northern Santa Fe, LLC (Registrant or collectively with its subsidiaries, BNSF or Company). Further information about the Merger is incorporated by reference from Note 1 to the Consolidated Financial Statements.
In its own words, from its 10-K, filed Mar 2, 2026.
Burlington Northern Santa FE, LLC against its Railroads, Line-Haul Operating peers
The largest companies of the same SEC industry, each at its latest quarter. Revenue growth: +14% against the peers' median +15%. Operating margin: 34.5% against the peers' median 35.2%.
| Company | Quarter | Revenue | Y/Y | Op. margin |
|---|---|---|---|---|
| Burlington Northern Santa FE, LLC | Q2 2026 | $6.6B | +14% | 34.5% |
| UNP Union Pacific | Q3 2026 | $7.2B | +15% | 40.9% |
| CSX CSX | Q3 2026 | $4.0B | +12% | 39.1% |
| NSC Norfolk Southern | Q3 2026 | $3.5B | +14% | 32.6% |
| CP Canadian Pacific Kansas City | Q3 2026 | $3.0B | +15% | 35.2% |
| FIP FTAI Infrastructure | Q3 2026 | $219M | +56% | 9.0% |
Source: Burlington Northern Santa FE, LLC 10-Q on SEC EDGAR · CIK 934612 · Railroads, Line-Haul Operating