Filing Flows › Industrials › CNH Industrial N.V. (CNH)
CNH Industrial N.V. (CNH) earnings and revenue breakdown
Latest: Q2 2026 · 10-Q filed Aug 3, 2026 · CNH Industrial N.V. (CNH) Q2 2026 earnings results →
Q2 2026 Revenue up 2% year over year to $4.8B · 3¢ of every $1 of revenue kept as net profit · operating margin 3.8%
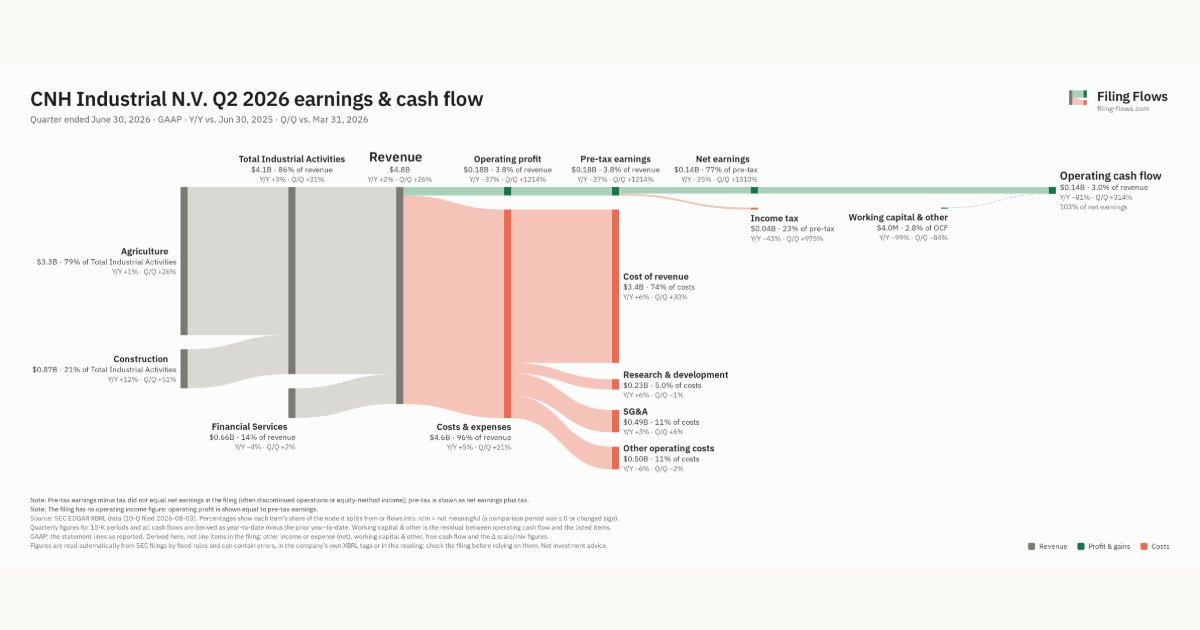
CNH Industrial N.V. made $4.8B in Q2 2026 (+2% Y/Y): Total Industrial Activities $4.1B, Financial Services $656M. Operating margin 3.8%, net earnings $141M. See where every dollar goes — costs, profit and cash — as a Sankey from the 10-Q filed Aug 3, 2026.
Drawing the Sankey…
Open the interactive Sankey → click any line for what the company wrote about it, compare Y/Y and Q/Q, export as PNG or PDF
What changed this quarter
Revenue was $4.8B in Q2 2026, up 2% year over year and up 26% from the previous quarter. Agriculture was the largest line at 68% of revenue. Construction added $0.09B year over year (up 12%), 101% of the total change. Financial Services declined 4%.
Operating profit was $0.18B, a 3.8% margin (down 2.4 points year over year). Operating profit fell $0.11B even though revenue rose $0.09B versus Q2 2025, so costs grew faster than sales. Total costs grew 5% against revenue growth of 2%. Net earnings were $0.14B, down 35% year over year. The effective tax rate was 23.4%.
Operating cash flow was $0.14B (down 81% year over year), 103% of net income including minority interests.
Quarterly history
| Quarter | Form | Filed | Revenue | Y/Y | Op. margin | Net earnings | Op. cash flow |
|---|---|---|---|---|---|---|---|
| Q2 2026 | 10-Q | Aug 3, 2026 | $4.8B | +2% | 3.8% | $141M | $145M |
| Q1 2026 | 10-Q | Apr 30, 2026 | $3.8B | -0.1% | 0.4% | $10.0M | $35.0M |
| Q4 2025 | 10-K | Feb 26, 2026 | $5.2B | +6% | 2.9% | $86.0M | $945M |
| Q3 2025 | 10-Q | Nov 7, 2025 | $4.4B | -6% | 1.5% | $80.0M | $659M |
| Q2 2025 | 10-Q | Aug 4, 2025 | $4.7B | -14% | 6.2% | $217M | $772M |
| Q1 2025 | 10-Q | May 6, 2025 | $3.8B | -20% | 4.7% | $132M | $162M |
| Q4 2024 | 10-K | Feb 28, 2025 | $4.9B | -28% | 5.4% | $176M | $1.7B |
Charts
Interactive views
The same charts as the app — open one to draw it.
💵Where each $1 goesinteractive
Loading the interactive chart…
🌏Named in Asian annual reportsinteractive
Loading the interactive chart…
🔄Rotation against the market and its industry (RRG)interactive
Loading the interactive chart…
🔍Earnings qualityinteractive
Loading the interactive chart…
⚖️Fair value by methodinteractive
Loading the interactive chart…
🔭Outlook & guidanceinteractive
Loading the interactive chart…
📈Investments: gains and what it boughtinteractive
Loading the interactive chart…
🏭Its industry’s money flow (input-output)interactive
Loading the interactive chart…
Customers and suppliers named in filings
Sells to
- CNH Industrial Capital LLC · Stated in 10-K (named, share not stated) · source
About CNH Industrial N.V.
CNH Industrial N.V. ("CNH" or the "Company") was formed in 2013 by the business combination transaction between Fiat Industrial S.p.A. and its subsidiary CNH Global N.V.. CNH was incorporated on November 23, 2012, as a public limited liability company ( naamloze vennootschap ) under the laws of the Netherlands. The Company's principal office is at Cranes Farm Road, Basildon, Essex, SS14 3AD, United Kingdom (telephone number: +44-207-9251-964). CNH's agent for U.S. federal securities law purposes is Britton Worthen, c/o CNH Industrial America LLC, 711 Jorie Boulevard, Oak Brook, Illinois 60523 (telephone number +1-331-256-0594).
In its own words, from its 10-K, filed Feb 26, 2026.
CNH Industrial N.V. against its Construction Machinery & Equip peers
The largest companies of the same SEC industry, each at its latest quarter. Revenue growth: +2% against the peers' median +25%. Operating margin: 3.8% against the peers' median 6.5%.
| Company | Quarter | Revenue | Y/Y | Op. margin |
|---|---|---|---|---|
| CNH CNH Industrial N.V. | Q2 2026 | $4.8B | +2% | 3.8% |
| CAT Caterpillar | Q3 2026 | $20.7B | +17% | 20.4% |
| MTW Manitowoc | Q3 2026 | $614M | +11% | 5.2% |
| CMCO Columbus McKinnon | Q2 FY27 | $539M | +107% | 6.5% |
| AEBI Aebi Schmidt Holding AG | Q2 2026 | $496M | +79% | 5.4% |
| ASTE Astec Industries | Q3 2026 | $352M | +0.7% | -0.9% |
| PLOW Douglas Dynamics | Q3 2026 | $218M | +34% | 14.3% |
| GENC Gencor Industries | Q3 FY26 | $33.8M | +25% | 17.2% |
Source: CNH Industrial N.V. 10-Q on SEC EDGAR · CIK 1567094 · Construction Machinery & Equip
More on CNH
History
Every quarter: Q2 2026 results · Q1 2026 results · Q4 2025 results · Q3 2025 results · Q2 2025 results · Q1 2025 results · Q4 2024 results
- CNH Industrial N.V. guidance history: guided vs reported
- CNH Industrial N.V. operating margin by quarter
- CNH Industrial N.V. net income by quarter
- CNH Industrial N.V. R&D spending by quarter
- CNH Industrial N.V. Total Industrial Activities revenue by quarter
- CNH Industrial N.V. Financial Services revenue by quarter