Filing Flows › Industrials › Coherent (COHR)
Coherent (COHR) earnings and revenue breakdown
Latest: Q1 FY27 · 10-Q filed Nov 4, 2026 · Coherent (COHR) Q1 FY27 earnings results →
Q1 FY27 Revenue up 50% year over year to $2.4B · 16¢ of every $1 of revenue kept as net profit · operating margin 15.1%
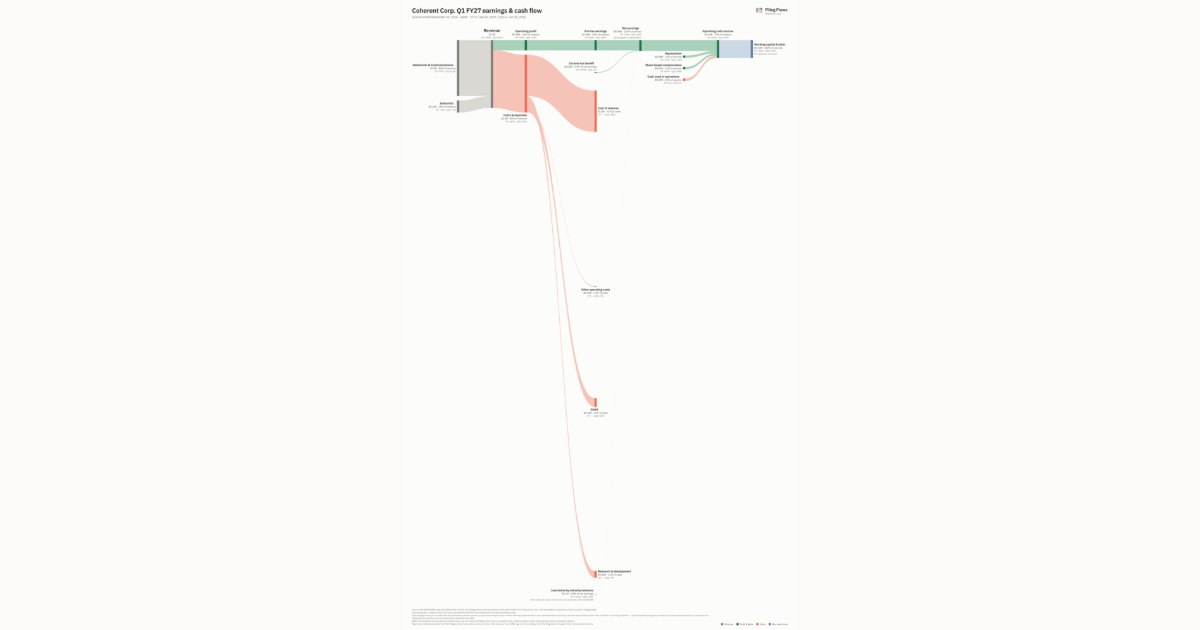
Coherent made $2.4B in Q1 FY27 (+50% Y/Y): Datacenter & Communications $2.0B, Industrial $419M. Operating margin 15.1%, net earnings $385M. See where every dollar goes — costs, profit and cash — as a Sankey from the 10-Q filed Nov 4, 2026.
Drawing the Sankey…
Open the interactive Sankey → click any line for what the company wrote about it, compare Y/Y and Q/Q, export as PNG or PDF
What changed this quarter
Revenue was $2.4B in Q1 FY27, up 50% year over year and up 16% from the previous quarter. Datacenter & Communications was the largest line at 82% of revenue. Datacenter & Communications added $0.86B year over year (up 79%), 109% of the total change. Industrial declined 15%.
Operating profit was $0.36B, a 15.1% margin (up 1.4 points year over year). Of the extra revenue versus Q1 FY26, 18% reached operating profit, above the 14% margin then. Total costs grew 47% against revenue growth of 50%. Net earnings were $0.38B, up 70% year over year ($0.38B including minority interests, which bore $3.1M of losses). The effective tax rate was -6.4%.
Operating cash flow was −$0.09B. Non-cash charges added back $0.08B of depreciation and $0.07B of share-based compensation. Working capital and other items used $0.63B. Capital expenditures of $0.78B exceeded it, leaving free cash flow of −$0.87B.
Quarterly history
| Quarter | Form | Filed | Revenue | Y/Y | Op. margin | Net earnings | Op. cash flow |
|---|---|---|---|---|---|---|---|
| Q1 FY27 | 10-Q | Nov 4, 2026 | $2.4B | +50% | 15.1% | $385M | −$92.7M |
| Q4 FY26 | 10-K | Aug 14, 2026 | $2.0B | +34% | 13.6% | $241M | $69.5M |
| Q3 FY26 | 10-Q | May 6, 2026 | $1.8B | +20% | 10.2% | $191M | −$93.8M |
| Q2 FY26 | 10-Q | Feb 4, 2026 | $1.7B | +18% | 10.0% | $147M | $57.9M |
| Q1 FY26 | 10-Q | Nov 5, 2025 | $1.6B | +17% | 13.7% | $226M | $46.0M |
| Q4 FY25 | 10-K | Aug 15, 2025 | $1.5B | +16% | -4.1% | −$98.1M | $130M |
| Q3 FY25 | 10-Q | May 7, 2025 | $1.5B | +24% | 0.7% | $15.7M | $163M |
Charts
In supply chains and themes
Interactive views
The same charts as the app — open one to draw it.
💵Where each $1 goesinteractive
Loading the interactive chart…
🌏Named in Asian annual reportsinteractive
Loading the interactive chart…
🔄Rotation against the market and its industry (RRG)interactive
Loading the interactive chart…
🔍Earnings qualityinteractive
Loading the interactive chart…
⚖️Fair value by methodinteractive
Loading the interactive chart…
🔭Outlook & guidanceinteractive
Loading the interactive chart…
📈Investments: gains and what it boughtinteractive
Loading the interactive chart…
🏭Its industry’s money flow (input-output)interactive
Loading the interactive chart…
About Coherent
Coherent Corp. (“Coherent,” the “Company,” “we,” “us,” or “our”), is a vertically integrated manufacturing company that develops, manufactures, and markets lasers, transceivers, and other optical and optoelectronic devices, modules, and systems, as well as engineered materials, for use in the data center, communications and industrial markets. Our headquarters are located at 375 Saxonburg Boulevard, Saxonburg, Pennsylvania 16056, USA. Our telephone number is +1-724-352-4455. Reference to “Coherent,” the “Company,” “we,” “us,” or “our” in this Annual Report on Form 10-K, unless the context requires otherwise, refers to Coherent Corp. and its wholly owned subsidiaries.
In its own words, from its 10-K, filed Aug 14, 2026.
Coherent against its Optical Instruments & Lenses peers
The largest companies of the same SEC industry, each at its latest quarter. Revenue growth: +50% against the peers' median +26%. Operating margin: 15.1% against the peers' median 14.3%.
| Company | Quarter | Revenue | Y/Y | Op. margin |
|---|---|---|---|---|
| COHR Coherent | Q1 FY27 | $2.4B | +50% | 15.1% |
| KLAC KLA | Q1 FY27 | $4.1B | +29% | 44.1% |
| OPXS Optex Systems Holdings | Q3 FY26 | $9.7M | -12% | 14.3% |
| OPTX Syntec Optics Holdings | Q2 2026 | $8.3M | +26% | 3.9% |
| MSAI MultiSensor AI Holdings | Q2 2026 | $1.7M | +20% | -153.5% |
Source: Coherent 10-Q on SEC EDGAR · CIK 820318 · Optical Instruments & Lenses
Guidance and outlook
13F: who owns COHR and who is buying
More on COHR
History
Every quarter: Q1 FY27 results · Q4 FY26 results · Q3 FY26 results · Q2 FY26 results · Q1 FY26 results · Q4 FY25 results · Q3 FY25 results