Filing Flows › Real Estate › Compass (COMP)
Compass (COMP) earnings and revenue breakdown
Latest: Q3 2026 · 10-Q filed Nov 6, 2026 · Compass (COMP) Q3 2026 earnings results →
Q3 2026 Revenue up 111% year over year to $3.9B · 2¢ of every $1 of revenue kept as net profit · operating margin 2.2%
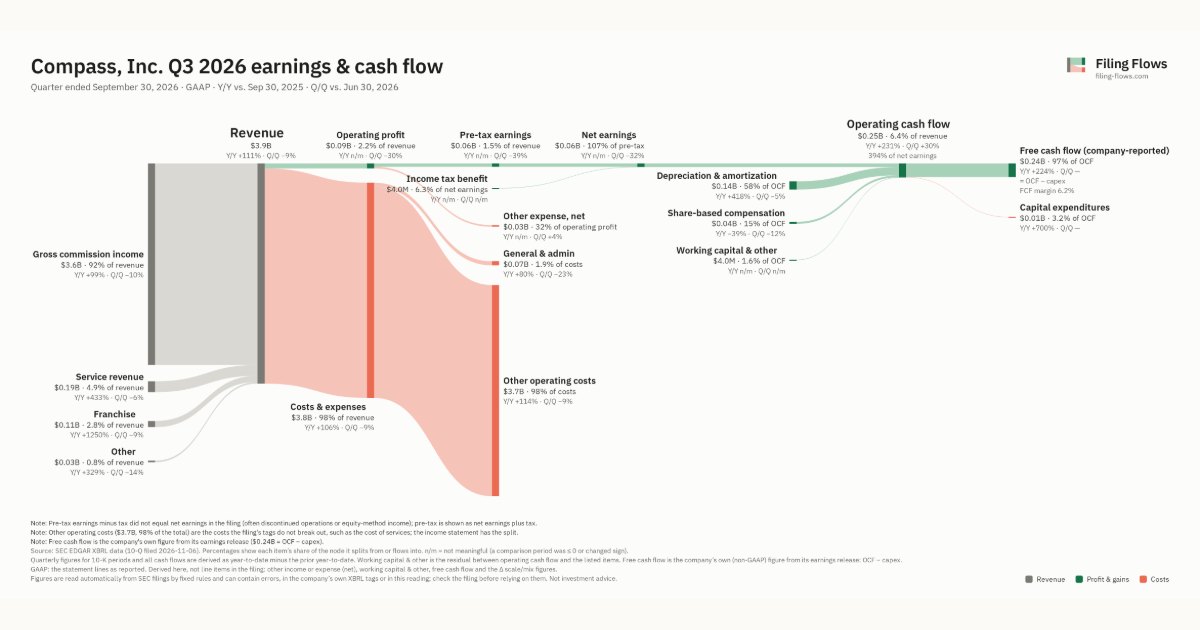
Compass made $3.9B in Q3 2026 (+111% Y/Y): Gross commission income $3.6B, Service revenue $192M, Franchise $108M. Operating margin 2.2%, net earnings $63.0M. See where every dollar goes — costs, profit and cash — as a Sankey from the 10-Q filed Nov 6, 2026.
Drawing the Sankey…
Open the interactive Sankey → click any line for what the company wrote about it, compare Y/Y and Q/Q, export as PNG or PDF
What changed this quarter
Revenue was $3.9B in Q3 2026, up 111% year over year and down 9% from the previous quarter. Gross commission income was the largest line at 92% of revenue. Gross commission income added $1.8B year over year (up 99%), 86% of the total change.
Operating profit was $0.09B, a 2.2% margin (up 2.6 points year over year). Total costs grew 106% against revenue growth of 111%. The fastest-growing cost line was Other operating costs (+114%). Net earnings were $0.06B. The effective tax rate was -6.8%.
Operating cash flow was $0.25B (up 231% year over year), 394% of net earnings. Non-cash charges added back $0.14B of depreciation and amortization and $0.04B of share-based compensation. After capital expenditures ($0.01B), free cash flow as the company reports it was $0.24B.
Quarterly history
| Quarter | Form | Filed | Revenue | Y/Y | Op. margin | Net earnings | Op. cash flow |
|---|---|---|---|---|---|---|---|
| Q3 2026 | 10-Q | Nov 6, 2026 | $3.9B | +111% | 2.2% | $63.0M | $248M |
| Q2 2026 | 10-Q | Aug 6, 2026 | $4.3B | +109% | 2.9% | $92.0M | $191M |
| Q1 2026 | 10-Q | May 8, 2026 | $2.7B | +99% | -13.0% | $22.0M | −$157M |
| Q4 2025 | 10-K | Feb 27, 2026 | $1.7B | +23% | -2.5% | −$42.7M | $45.7M |
| Q3 2025 | 10-Q | Nov 5, 2025 | $1.8B | +24% | -0.4% | −$4.6M | $75.0M |
| Q2 2025 | 10-Q | Aug 4, 2025 | $2.1B | +21% | 1.9% | $39.0M | $73.0M |
| Q1 2025 | 10-Q | May 9, 2025 | $1.4B | +29% | -4.0% | −$51.0M | $23.0M |
Charts
Interactive views
The same charts as the app — open one to draw it.
💵Where each $1 goesinteractive
Loading the interactive chart…
🌏Named in Asian annual reportsinteractive
Loading the interactive chart…
🔄Rotation against the market and its industry (RRG)interactive
Loading the interactive chart…
🔍Earnings qualityinteractive
Loading the interactive chart…
⚖️Fair value by methodinteractive
Loading the interactive chart…
🔭Outlook & guidanceinteractive
Loading the interactive chart…
📈Investments: gains and what it boughtinteractive
Loading the interactive chart…
🏭Its industry’s money flow (input-output)interactive
Loading the interactive chart…
Customers and suppliers named in filings
Buys from
About Compass
Compass, Inc., d/b/a Compass International Holdings (the “Company”), was incorporated in Delaware on October 4, 2012 under the name Urban Compass, Inc. The Company has been based in New York City since its incorporation. On January 9, 2026, the Company completed its previously announced acquisition of Anywhere Real Estate Inc. (“Anywhere”) pursuant to the Agreement and Plan of Merger, dated as of September 22, 2025 (the “Anywhere Merger Agreement”), with Anywhere surviving the merger as a wholly owned subsidiary of the Company (the “Anywhere Merger”).
In its own words, from its 10-K, filed Feb 27, 2026.
Compass against its Real Estate Agents & Managers (For Others) peers
The largest companies of the same SEC industry, each at its latest quarter. Revenue growth: +111% against the peers' median +12%. Operating margin: 2.2% against the peers' median 0.2%.
| Company | Quarter | Revenue | Y/Y | Op. margin |
|---|---|---|---|---|
| COMP Compass | Q3 2026 | $3.9B | +111% | 2.2% |
| JLL Jones Lang Lasalle | Q3 2026 | $7.3B | +12% | 5.4% |
| AGNT Agnt | Q3 2026 | $1.4B | +6% | 0.2% |
| VAC Marriott Vacations Worldwide | Q3 2026 | $1.4B | +8% | 11.2% |
| OPEN Opendoor Technologies | Q3 2026 | $1.0B | +12% | -18.3% |
| NMRK Newmark Group | Q3 2026 | $973M | +13% | 8.8% |
| REAX Real Remax Group | Q3 2026 | $728M | +28% | -9.9% |
| DOUG Douglas Elliman | Q2 2026 | $283M | +4% | -1.2% |
| MMI Marcus & Millichap | Q3 2026 | $208M | +8% | -0.4% |
Source: Compass 10-Q on SEC EDGAR · CIK 1563190 · Real Estate Agents & Managers (For Others)
Guidance and outlook
13F: who owns COMP and who is buying
More on COMP
- How Compass makes money: revenue by segment
- Compass next earnings date and what analysts expect
- Compass stock forecast, price target and fair value
- Who owns Compass stock: holders, funds and Congress trades
- Compass guidance and outlook
- Is Compass a takeover target? LBO and rumors
- Compass recalls, complaints and regulation
History
Every quarter: Q3 2026 results · Q2 2026 results · Q1 2026 results · Q4 2025 results · Q3 2025 results · Q2 2025 results · Q1 2025 results
- Compass guidance history: guided vs reported
- Compass operating margin by quarter
- Compass net income by quarter
- Compass free cash flow by quarter
- Compass R&D spending by quarter
- Compass capital expenditures by quarter
- Compass Gross commission income revenue by quarter
- Compass Service revenue revenue by quarter
- Compass Franchise revenue by quarter