Filing Flows › Materials › Carlisle Companies (CSL)
Carlisle Companies (CSL) earnings and revenue breakdown
Latest: Q3 2026 · 10-Q filed Oct 29, 2026 · Carlisle Companies (CSL) Q3 2026 earnings results →
Q3 2026 Revenue up 9% year over year to $1.5B · 14¢ of every $1 of revenue kept as net profit · operating margin 20.0%
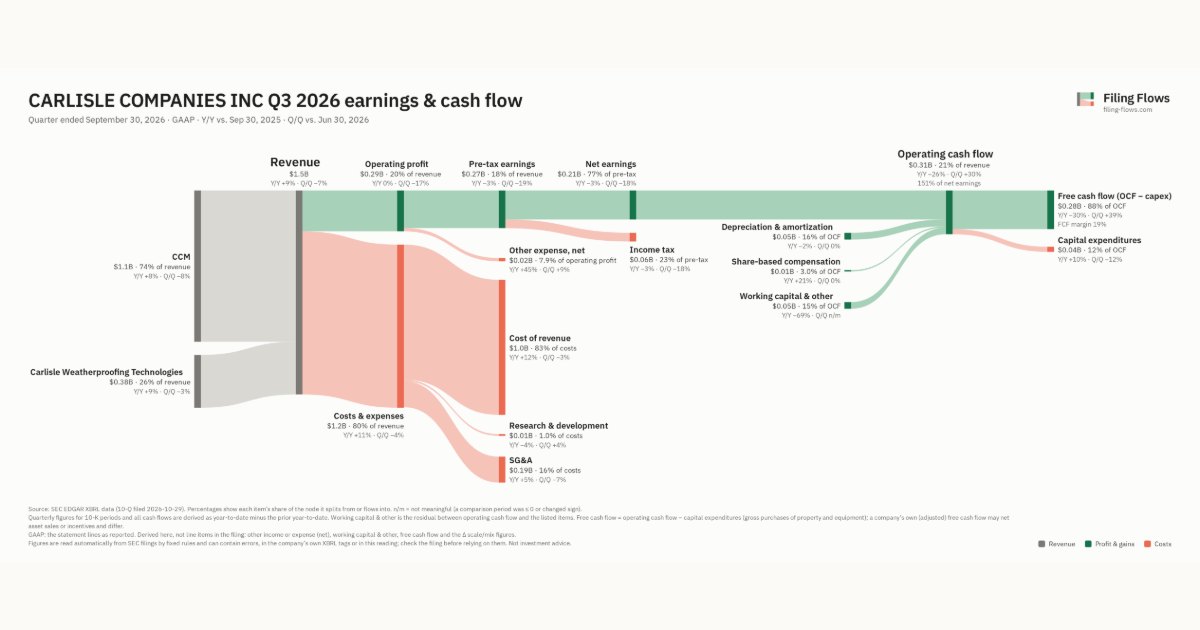
Carlisle Companies made $1.5B in Q3 2026 (+9% Y/Y): CCM $1.1B, Carlisle Weatherproofing Technologies $378M. Operating margin 20.0%, net earnings $208M. See where every dollar goes — costs, profit and cash — as a Sankey from the 10-Q filed Oct 29, 2026.
Drawing the Sankey…
Open the interactive Sankey → click any line for what the company wrote about it, compare Y/Y and Q/Q, export as PNG or PDF
What changed this quarter
Revenue was $1.5B in Q3 2026, up 9% year over year and down 7% from the previous quarter. CCM was the largest line at 74% of revenue. CCM added $0.08B year over year (up 8%), 72% of the total change.
Operating profit was $0.29B, a 20.0% margin (down 1.8 points year over year). Operating profit fell $700K even though revenue rose $0.12B versus Q3 2025, so costs grew faster than sales. Total costs grew 11% against revenue growth of 9%. The fastest-growing cost line was Cost of revenue (+12%). Net earnings were $0.21B, down 3% year over year. The effective tax rate was 23.2%.
Operating cash flow was $0.31B (down 26% year over year), 151% of net earnings. Non-cash charges added back $0.05B of depreciation and amortization and $0.01B of share-based compensation. Working capital and other items added $0.05B. Capital expenditures of $0.04B left free cash flow of $0.28B.
Quarterly history
| Quarter | Form | Filed | Revenue | Y/Y | Op. margin | Net earnings | Op. cash flow |
|---|---|---|---|---|---|---|---|
| Q3 2026 | 10-Q | Oct 29, 2026 | $1.5B | +9% | 20.0% | $208M | $314M |
| Q2 2026 | 10-Q | Jul 30, 2026 | $1.6B | +8% | 22.4% | $255M | $242M |
| Q1 2026 | 10-Q | Apr 24, 2026 | $1.1B | -4% | 17.1% | $128M | −$44.7M |
| Q4 2025 | 10-K | Feb 13, 2026 | $1.1B | +0.4% | 16.8% | $127M | $386M |
| Q3 2025 | 10-Q | Oct 30, 2025 | $1.3B | +1% | 21.8% | $214M | $427M |
| Q2 2025 | 10-Q | Jul 31, 2025 | $1.4B | -0.1% | 23.1% | $256M | $287M |
| Q1 2025 | 10-Q | Apr 24, 2025 | $1.1B | -0.1% | 16.8% | $143M | $1.8M |
Charts
Interactive views
The same charts as the app — open one to draw it.
💵Where each $1 goesinteractive
Loading the interactive chart…
🌏Named in Asian annual reportsinteractive
Loading the interactive chart…
🔄Rotation against the market and its industry (RRG)interactive
Loading the interactive chart…
🔍Earnings qualityinteractive
Loading the interactive chart…
⚖️Fair value by methodinteractive
Loading the interactive chart…
🔭Outlook & guidanceinteractive
Loading the interactive chart…
📈Investments: gains and what it boughtinteractive
Loading the interactive chart…
🏭Its industry’s money flow (input-output)interactive
Loading the interactive chart…
Customers and suppliers named in filings
Sells to
About Carlisle Companies
Carlisle Companies Incorporated (“Carlisle,” the “Company,” “we,” “us” or “our”) is a leading supplier of innovative building envelope products and solutions for more energy-efficient buildings. Through our building products businesses, Carlisle Construction Materials and Carlisle Weatherproofing Technologies, and family of leading brands, Carlisle delivers innovative, labor reducing and environmentally responsible products and solutions to customers through the Carlisle Experience. Our Company website is www.carlisle.com , through which we make available, free of charge, our Annual Report on Form 10-K, Quarterly Reports on Form 10-Q and Current Reports on Form 8-K and all amendments to those reports, as soon as reasonably practicable after these reports are electronically filed with or furnished to the Securities and Exchange Commission (“SEC”).
In its own words, from its 10-K, filed Feb 13, 2026.
Carlisle Companies against its Fabricated Rubber Products, NEC peers
The largest companies of the same SEC industry, each at its latest quarter. Revenue growth: +9% against the peers' median +9%. Operating margin: 20.0% against the peers' median -1.6%.
| Company | Quarter | Revenue | Y/Y | Op. margin |
|---|---|---|---|---|
| CSL Carlisle Companies | Q3 2026 | $1.5B | +9% | 20.0% |
| YHGJ Yunhong Green CTI | Q1 2026 | $6.2M | +28% | -1.6% |
| VYST Vystar | Q2 2026 | $8K | -33% | n/m |
Source: Carlisle Companies 10-Q on SEC EDGAR · CIK 790051 · Fabricated Rubber Products, NEC
13F: who owns CSL and who is buying
More on CSL
- How Carlisle Companies makes money: revenue by segment
- Carlisle Companies next earnings date and what analysts expect
- Carlisle Companies stock forecast, price target and fair value
- Who owns Carlisle Companies stock: holders, funds and Congress trades
- Is Carlisle Companies a takeover target? LBO and rumors
History
Every quarter: Q3 2026 results · Q2 2026 results · Q1 2026 results · Q4 2025 results · Q3 2025 results · Q2 2025 results · Q1 2025 results
- Carlisle Companies operating margin by quarter
- Carlisle Companies net income by quarter
- Carlisle Companies free cash flow by quarter
- Carlisle Companies R&D spending by quarter
- Carlisle Companies capital expenditures by quarter
- Carlisle Companies CCM revenue by quarter
- Carlisle Companies Carlisle Weatherproofing Technologies revenue by quarter