Filing Flows › Industrials › QXO (QXO)
QXO (QXO) earnings and revenue breakdown
Latest: Q2 2026 · 10-Q filed Aug 14, 2026 · QXO (QXO) Q2 2026 earnings results →
Q2 2026 Revenue up 70% year over year to $3.2B · 2¢ of every $1 of revenue lost · operating margin -1.3%
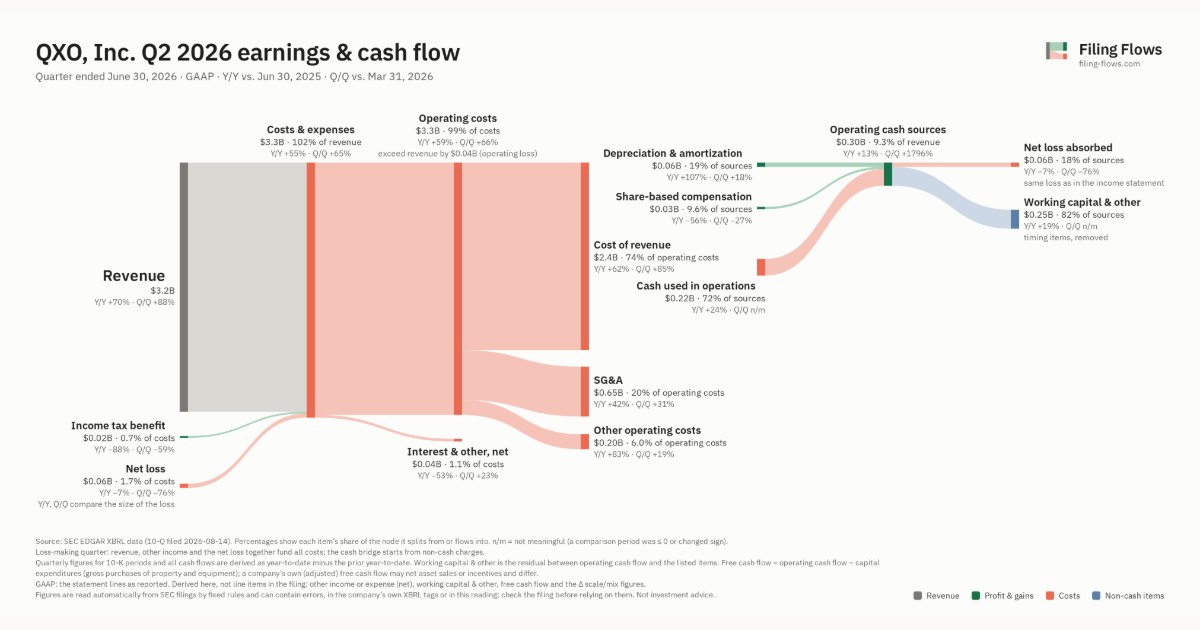
QXO made $3.2B in Q2 2026 (+70% Y/Y). Operating margin -1.3%, net loss $55.0M. See where every dollar goes — costs, profit and cash — as a Sankey from the 10-Q filed Aug 14, 2026.
Drawing the Sankey…
Open the interactive Sankey → click any line for what the company wrote about it, compare Y/Y and Q/Q, export as PNG or PDF
What changed this quarter
Revenue was $3.2B in Q2 2026, up 70% year over year and up 88% from the previous quarter.
Gross margin was 24.7%, up 3.7 points from Q2 2025. Operating costs exceeded revenue by $0.04B, an operating margin of -1.3%. Operating expenses grew 50% against revenue growth of 70%. The fastest-growing cost line was Other operating costs (+83%). The quarter ended with a net loss of $0.06B, narrower than the previous quarter's $0.23B loss. Net interest and other expense of $0.04B was the main reason.
Operating cash flow was −$0.22B. Non-cash charges added back $0.06B of depreciation and amortization and $0.03B of share-based compensation. Working capital and other items used $0.25B. Capital expenditures of $0.03B exceeded it, leaving free cash flow of −$0.25B.
Quarterly history
| Quarter | Form | Filed | Revenue | Y/Y | Op. margin | Net earnings | Op. cash flow |
|---|---|---|---|---|---|---|---|
| Q2 2026 | 10-Q | Aug 14, 2026 | $3.2B | +70% | -1.3% | −$55.0M | −$217M |
| Q1 2026 | 10-Q | May 12, 2026 | $1.7B | 128× | -14.6% | −$227M | $70.6M |
| Q4 2025 | 10-K | Feb 27, 2026 | $2.2B | 148× | -3.2% | −$90.2M | $187M |
| Q3 2025 | 10-Q | Nov 6, 2025 | $2.7B | 208× | 0.9% | −$139M | $213M |
| Q2 2025 | 10-Q | Aug 14, 2025 | $1.9B | 131× | -8.6% | −$59.0M | −$174M |
| Q1 2025 | 10-Q | May 8, 2025 | $13.5M | -6% | -291.1% | $8.8M | $36.5M |
| Q4 2024 | 10-K | Mar 4, 2025 | $14.8M | +0.6% | -224.3% | $11.3M | $53.9M |
Charts
Interactive views
The same charts as the app — open one to draw it.
💵Where each $1 goesinteractive
Loading the interactive chart…
🌏Named in Asian annual reportsinteractive
Loading the interactive chart…
🔄Rotation against the market and its industry (RRG)interactive
Loading the interactive chart…
🔍Earnings qualityinteractive
Loading the interactive chart…
⚖️Fair value by methodinteractive
Loading the interactive chart…
🔭Outlook & guidanceinteractive
Loading the interactive chart…
📈Investments: gains and what it boughtinteractive
Loading the interactive chart…
🏭Its industry’s money flow (input-output)interactive
Loading the interactive chart…
Customers and suppliers named in filings
Buys from
About QXO
QXO, Inc. (“QXO”, “we”, “our”, or the “Company”) was created to build a tech-forward leader in the approximately $800 billion building products distribution sector. The Company was formerly known as SilverSun Technologies, Inc. (“SilverSun”). On June 6, 2024, we changed the Company’s name from SilverSun to QXO. Prior to the Beacon Acquisition (as defined below), QXO was primarily a technology solutions and professional services company, providing critical software applications, consulting and other professional services, including specialized programming, training and technical support to small and mid-size companies in the manufacturing, distribution and services industries.
In its own words, from its 10-K, filed Feb 27, 2026.
QXO against its Wholesale-Lumber & Other Construction Materials peers
The largest companies of the same SEC industry, each at its latest quarter. Revenue growth: +70% against the peers' median +67%. Operating margin: -1.3% against the peers' median -1.3%.
| Company | Quarter | Revenue | Y/Y | Op. margin |
|---|---|---|---|---|
| QXO QXO | Q2 2026 | $3.2B | +70% | -1.3% |
| BCC Boise Cascade | Q3 2026 | $1.8B | +8% | 3.1% |
| ASPN Aspen Aerogels | Q3 2026 | $85.2M | +17% | -8.4% |
| CAPS Capstone Holding | Q2 2026 | $21.5M | +67% | 2.0% |
| OLOX Olenox Industries | Q2 2026 | $2.1M | +194% | -138.7% |
Source: QXO 10-Q on SEC EDGAR · CIK 1236275 · Wholesale-Lumber & Other Construction Materials
13F: who owns QXO and who is buying
More on QXO
History
Every quarter: Q2 2026 results · Q1 2026 results · Q4 2025 results · Q3 2025 results · Q2 2025 results · Q1 2025 results · Q4 2024 results