Filing Flows › Health Care › Community Health Systems (CYH)
Community Health Systems (CYH) earnings and revenue breakdown
Latest: Q3 2026 · 10-Q filed Oct 29, 2026 · Community Health Systems (CYH) Q3 2026 earnings results →
Q3 2026 Revenue down 11% year over year to $2.8B · 2¢ of every $1 of revenue lost · operating margin 5.3%
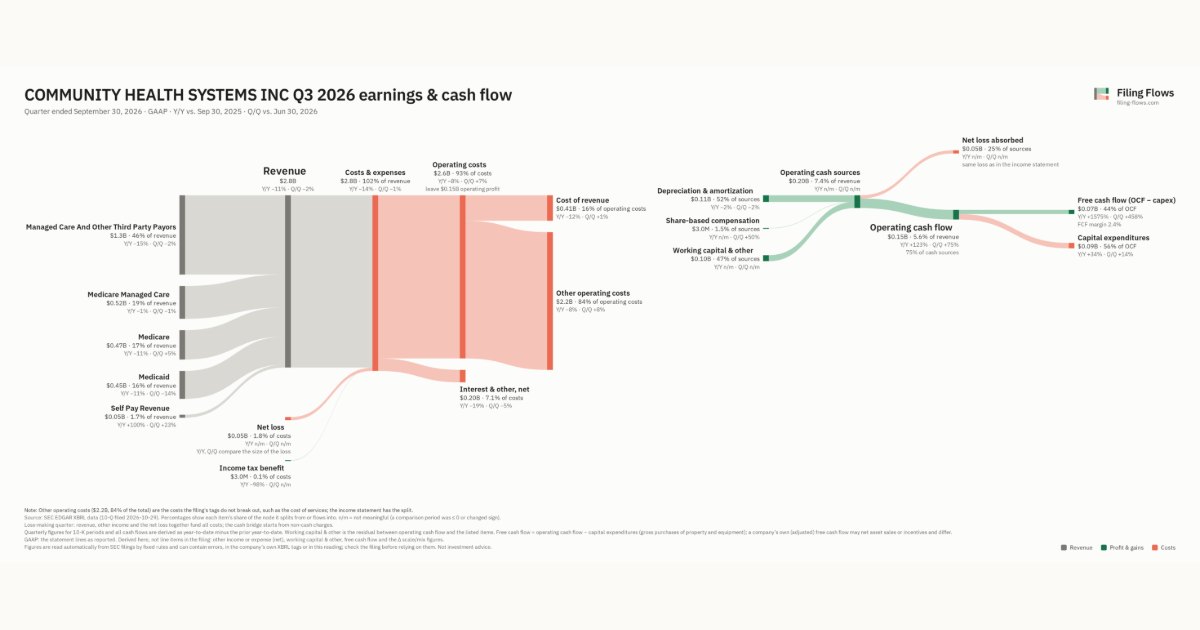
Community Health Systems made $2.8B in Q3 2026 (-11% Y/Y): Managed Care and Other Third Party Payors $1.3B, Medicare Managed Care $524M, Medicare $469M. Operating margin 5.3%, net loss $50.0M. See where every dollar goes — costs, profit and cash — as a Sankey from the 10-Q filed Oct 29, 2026.
Drawing the Sankey…
Open the interactive Sankey → click any line for what the company wrote about it, compare Y/Y and Q/Q, export as PNG or PDF
What changed this quarter
Revenue was $2.8B in Q3 2026, down 11% year over year and down 2% from the previous quarter. Managed Care and Other Third Party Payors was the largest line at 46% of revenue. Managed Care and Other Third Party Payors lost $0.23B year over year (down 15%), 70% of the total change.
Operating profit was $0.15B, a 5.3% margin (down 2.6 points year over year). Total costs fell 8% while revenue fell 11%. The quarter ended with a net loss of $0.05B, after a profit of $0.10B the previous quarter. Net interest and other expense of $0.20B was the main reason.
Operating cash flow was $0.15B (up 123% year over year). Non-cash charges added back $0.11B of depreciation and amortization and $3.0M of share-based compensation. Working capital and other items added $0.10B. Capital expenditures of $0.09B left free cash flow of $0.07B.
Quarterly history
| Quarter | Form | Filed | Revenue | Y/Y | Op. margin | Net earnings | Op. cash flow |
|---|---|---|---|---|---|---|---|
| Q3 2026 | 10-Q | Oct 29, 2026 | $2.8B | -11% | 5.3% | −$50.0M | $154M |
| Q2 2026 | 10-Q | Jul 23, 2026 | $2.8B | -10% | 13.8% | $70.0M | $88.0M |
| Q1 2026 | 10-Q | Apr 22, 2026 | $3.0B | -6% | 9.5% | −$25.0M | −$297M |
| Q4 2025 | 10-K | Feb 19, 2026 | $3.1B | -5% | 14.5% | $110M | $266M |
| Q3 2025 | 10-Q | Oct 24, 2025 | $3.1B | -0.1% | 7.9% | $171M | $69.0M |
| Q2 2025 | 10-Q | Jul 24, 2025 | $3.1B | -0.2% | 16.3% | $282M | $88.0M |
| Q1 2025 | 10-Q | Apr 24, 2025 | $3.2B | +0.6% | 9.0% | $25.0M | $120M |
Charts
Interactive views
The same charts as the app — open one to draw it.
💵Where each $1 goesinteractive
Loading the interactive chart…
🌏Named in Asian annual reportsinteractive
Loading the interactive chart…
🔄Rotation against the market and its industry (RRG)interactive
Loading the interactive chart…
🔍Earnings qualityinteractive
Loading the interactive chart…
⚖️Fair value by methodinteractive
Loading the interactive chart…
🔭Outlook & guidanceinteractive
Loading the interactive chart…
📈Investments: gains and what it boughtinteractive
Loading the interactive chart…
🏭Its industry’s money flow (input-output)interactive
Loading the interactive chart…
About Community Health Systems
We are one of the nation’s largest healthcare companies. Our affiliates are leading providers of healthcare services, developing and operating healthcare delivery systems in 36 distinct markets across 14 states. At December 31, 2025, our subsidiaries own or lease 69 affiliated hospitals, with more than 10,000 beds, and operate more than 1,000 sites of care, including physician practices, urgent care centers, freestanding emergency departments, occupational medicine clinics, imaging centers, cancer centers and ambulatory surgery centers. We generate revenues by providing a broad range of general and specialized hospital healthcare services and outpatient services to patients in the communities in which we are located.
In its own words, from its 10-K, filed Feb 19, 2026.
Community Health Systems against its Services-General Medical & Surgical Hospitals, NEC peers
The largest companies of the same SEC industry, each at its latest quarter. Revenue growth: -11% against the peers' median +4%. Operating margin: 5.3% against the peers' median 11.9%.
| Company | Quarter | Revenue | Y/Y | Op. margin |
|---|---|---|---|---|
| CYH Community Health Systems | Q3 2026 | $2.8B | -11% | 5.3% |
| HCA HCA Healthcare | Q3 2026 | $19.8B | +4% | 11.9% |
| THC Tenet Healthcare | Q3 2026 | $5.6B | +6% | 31.1% |
| UHS Universal Health Services | Q3 2026 | $4.7B | +5% | 9.6% |
| ARDT Ardent Health | Q3 2026 | $1.6B | +3% | 5.0% |
| SGRY Surgery Partners | Q2 2026 | $849M | +3% | 12.0% |
Source: Community Health Systems 10-Q on SEC EDGAR · CIK 1108109 · Services-General Medical & Surgical Hospitals, NEC
13F: who owns CYH and who is buying
More on CYH
- How Community Health Systems makes money: revenue by segment
- Community Health Systems next earnings date and what analysts expect
- Community Health Systems stock forecast, price target and fair value
- Who owns Community Health Systems stock: holders, funds and Congress trades
- Community Health Systems guidance and outlook
- Is Community Health Systems a takeover target? LBO and rumors
- Community Health Systems recalls, complaints and regulation
History
Every quarter: Q3 2026 results · Q2 2026 results · Q1 2026 results · Q4 2025 results · Q3 2025 results · Q2 2025 results · Q1 2025 results
- Community Health Systems guidance history: guided vs reported
- Community Health Systems operating margin by quarter
- Community Health Systems net income by quarter
- Community Health Systems free cash flow by quarter
- Community Health Systems capital expenditures by quarter
- Community Health Systems Managed Care and Other Third Party Payors revenue by quarter
- Community Health Systems Medicare Managed Care revenue by quarter
- Community Health Systems Medicare revenue by quarter