Filing Flows › Consumer Staples › Darling Ingredients (DAR)
Darling Ingredients (DAR) earnings and revenue breakdown
Latest: Q3 2026 · 8-K filed Oct 28, 2026
Q3 2026 Revenue up 14% year over year to $1.8B · 15¢ of every $1 of revenue kept as net profit · operating margin 18.6%
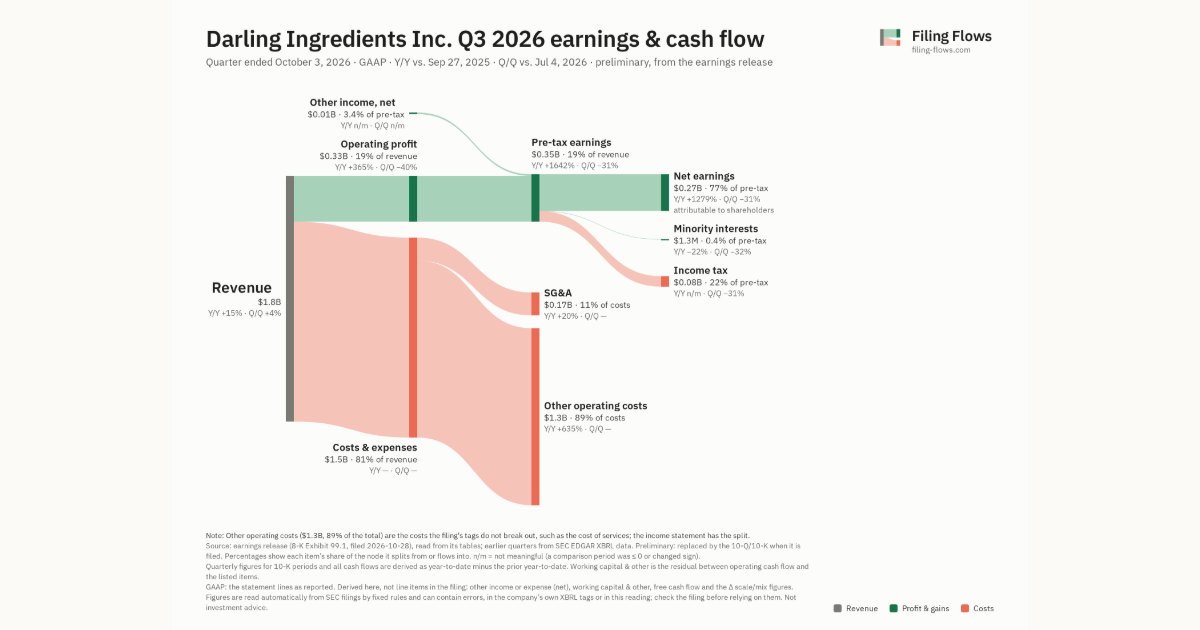
Darling Ingredients made $1.8B in Q3 2026 (+14% Y/Y). Operating margin 18.6%, net earnings $267M. See where every dollar goes — costs, profit and cash — as a Sankey from the 8-K filed Oct 28, 2026 (preliminary, from the earnings release).
Drawing the Sankey…
Open the interactive Sankey → click any line for what the company wrote about it, compare Y/Y and Q/Q, export as PNG or PDF
What changed this quarter
Revenue was $1.8B in Q3 2026, up 15% year over year and up 4% from the previous quarter.
Operating profit was $0.33B, a 18.6% margin (up 14.0 points year over year). Of the extra revenue versus Q3 2025, 115% reached operating profit, above the 5% margin then. The fastest-growing cost line was Other operating costs (+635%). Net earnings were $0.27B, up 1279% year over year. The effective tax rate was 22.3%.
Quarterly history
| Quarter | Form | Filed | Revenue | Y/Y | Op. margin | Net earnings | Op. cash flow |
|---|---|---|---|---|---|---|---|
| Q3 2026 | 8-K | Oct 28, 2026 | $1.8B | +14% | 18.6% | $267M | — |
| Q2 2026 | 10-Q | Aug 7, 2026 | $1.7B | +16% | 32.2% | $387M | $533M |
| Q1 2026 | 10-Q | May 8, 2026 | $1.6B | +12% | 14.6% | $134M | $153M |
| Q4 2025 | 10-K | Mar 3, 2026 | $1.7B | +21% | 5.7% | $56.9M | $441M |
| Q3 2025 | 10-Q | Nov 5, 2025 | $1.6B | +10% | 4.6% | $19.4M | $224M |
| Q2 2025 | 10-Q | Aug 6, 2025 | $1.5B | +2% | 5.1% | $12.7M | $146M |
| Q1 2025 | 10-Q | May 7, 2025 | $1.4B | -3% | 2.1% | −$23.8M | $249M |
Charts
Interactive views
The same charts as the app — open one to draw it.
💵Where each $1 goesinteractive
Loading the interactive chart…
🌏Named in Asian annual reportsinteractive
Loading the interactive chart…
🔄Rotation against the market and its industry (RRG)interactive
Loading the interactive chart…
🔍Earnings qualityinteractive
Loading the interactive chart…
⚖️Fair value by methodinteractive
Loading the interactive chart…
🔭Outlook & guidanceinteractive
Loading the interactive chart…
📈Investments: gains and what it boughtinteractive
Loading the interactive chart…
🏭Its industry’s money flow (input-output)interactive
Loading the interactive chart…
About Darling Ingredients
Founded by the Swift meat packing interests and the Darling family in 1882, Darling Ingredients Inc. (“Darling”, and together with its subsidiaries, the “Company” or “we,” “us” or “our”) was incorporated in Delaware in 1962 under the name “Darling-Delaware Company, Inc.” Darling changed its name from “Darling-Delaware Company, Inc.” to “Darling International Inc.” on December 28, 1993, and from “Darling International Inc.” to “Darling Ingredients Inc.” on May 6, 2014. The address of Darling's principal executive office is 5601 N MacArthur Boulevard, Irving, Texas, 75038, and its telephone number at this address is (972) 717-0300.
In its own words, from its 10-K, filed Mar 3, 2026.
Darling Ingredients against its Fats & Oils peers
The largest companies of the same SEC industry, each at its latest quarter. Revenue growth: +14% against the peers' median +14%. Operating margin: 18.6% against the peers' median 10.4%.
| Company | Quarter | Revenue | Y/Y | Op. margin |
|---|---|---|---|---|
| DAR Darling Ingredients | Q3 2026 | $1.8B | +14% | 18.6% |
| BG Bunge Global SA | Q3 2026 | $23.8B | +7% | 2.2% |
| ADM Archer-Daniels-Midland | Q3 2026 | $22.3B | +10% | 4.5% |
| SDSYA South Dakota Soybean Processors LLC | Q2 2026 | $327M | +196% | 10.4% |
Source: Darling Ingredients 8-K on SEC EDGAR · CIK 916540 · Fats & Oils
Guidance and outlook
13F: who owns DAR and who is buying
More on DAR
- How Darling Ingredients makes money: revenue by segment
- Darling Ingredients next earnings date and what analysts expect
- Darling Ingredients stock forecast, price target and fair value
- Who owns Darling Ingredients stock: holders, funds and Congress trades
- Darling Ingredients guidance and outlook
- Is Darling Ingredients a takeover target? LBO and rumors
- Darling Ingredients recalls, complaints and regulation
History
Every quarter: Q3 2026 results · Q2 2026 results · Q1 2026 results · Q4 2025 results · Q3 2025 results · Q2 2025 results · Q1 2025 results