Filing Flows › Consumer Discretionary › Dillard's (DDS)
Dillard's (DDS) earnings and revenue breakdown
Latest: Q2 FY27 · 10-Q filed Sep 4, 2026 · Dillard's (DDS) Q2 FY27 earnings results →
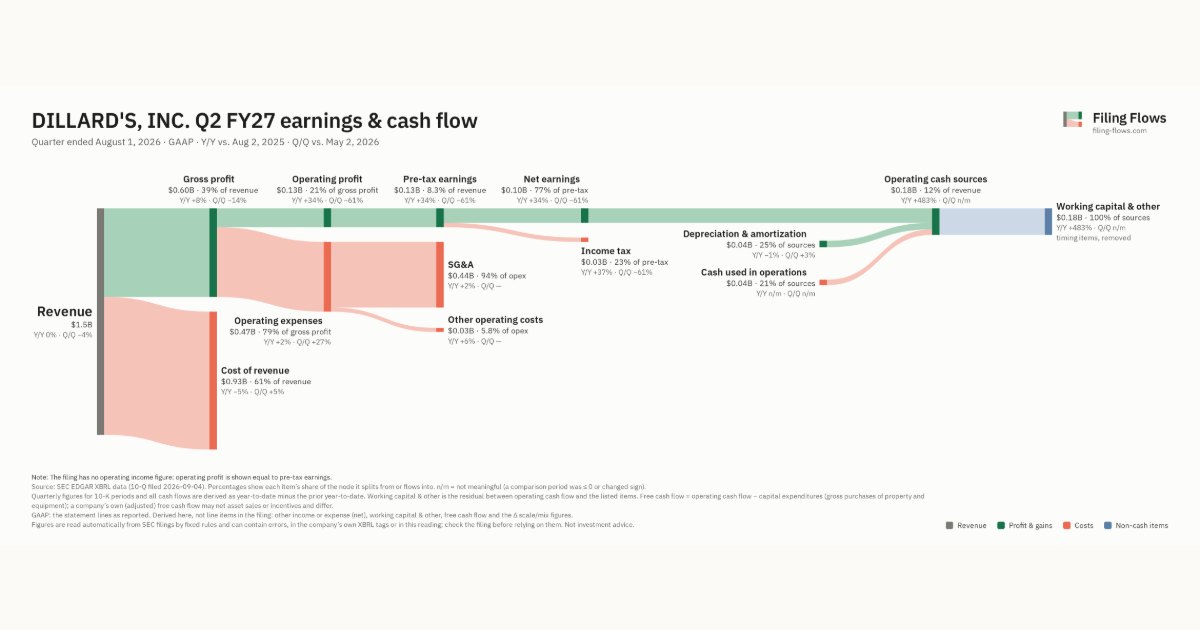
Q2 FY27 Revenue down 0% year over year to $1.5B · 6¢ of every $1 of revenue kept as net profit · operating margin 8.3%
Dillard's made $1.5B in Q2 FY27 (-0.4% Y/Y). Operating margin 8.3%, net earnings $97.7M. See where every dollar goes — costs, profit and cash — as a Sankey from the 10-Q filed Sep 4, 2026.
Drawing the Sankey…
Open the interactive Sankey → click any line for what the company wrote about it, compare Y/Y and Q/Q, export as PNG or PDF
What changed this quarter
Revenue was $1.5B in Q2 FY27, roughly flat year over year and down 4% from the previous quarter.
Gross margin was 39.1%, up 3.0 points from Q2 FY26. Operating profit was $0.13B, a 8.3% margin (up 2.1 points year over year). Operating expenses grew 2% against flat revenue. Net earnings were $0.10B, up 34% year over year. The effective tax rate was 23.4%.
Operating cash flow was −$0.04B. Non-cash charges added back $0.04B of depreciation and amortization. Working capital and other items used $0.18B. Capital expenditures of $0.02B exceeded it, leaving free cash flow of −$0.06B.
Quarterly history
| Quarter | Form | Filed | Revenue | Y/Y | Op. margin | Net earnings | Op. cash flow |
|---|---|---|---|---|---|---|---|
| Q2 FY27 | 10-Q | Sep 4, 2026 | $1.5B | -0.4% | 8.3% | $97.7M | −$37.2M |
| Q1 FY27 | 10-Q | Jun 5, 2026 | $1.6B | +3% | 20.6% | $251M | $364M |
| Q4 FY26 | 10-K | Mar 27, 2026 | $2.0B | -3% | 10.9% | $204M | $211M |
| Q3 FY26 | 10-Q | Dec 5, 2025 | $1.5B | +3% | 11.3% | $130M | $186M |
| Q2 FY26 | 10-Q | Sep 5, 2025 | $1.5B | +1% | 6.2% | $72.8M | $86.8M |
| Q1 FY26 | 10-Q | Jun 6, 2025 | $1.5B | -2% | 13.8% | $164M | $233M |
| Q4 FY25 | 10-K | Mar 28, 2025 | $2.1B | -5% | 11.5% | $214M | $365M |
Charts
Interactive views
The same charts as the app — open one to draw it.
💵Where each $1 goesinteractive
Loading the interactive chart…
🌏Named in Asian annual reportsinteractive
Loading the interactive chart…
🔄Rotation against the market and its industry (RRG)interactive
Loading the interactive chart…
🔍Earnings qualityinteractive
Loading the interactive chart…
⚖️Fair value by methodinteractive
Loading the interactive chart…
🔭Outlook & guidanceinteractive
Loading the interactive chart…
📈Investments: gains and what it boughtinteractive
Loading the interactive chart…
🏭Its industry’s money flow (input-output)interactive
Loading the interactive chart…
Customers and suppliers named in filings
Buys from
About Dillard's
Dillard’s, Inc. (“Dillard’s”, the “Company”, “we”, “us”, “our” or “Registrant”) ranks among the nation’s largest fashion apparel, cosmetics and home furnishing retailers. The Company, originally founded in 1938 by William T. Dillard, was incorporated in Delaware in 1964. As of February 1, 2025, we operated 272 Dillard’s stores, including 28 clearance centers, and an Internet store at dillards.com offering a wide selection of merchandise including fashion apparel for women, men and children, accessories, cosmetics, home furnishings and other consumer goods. The Company also operates a general contracting construction company, CDI Contractors, LLC (“CDI”), a portion of whose business includes constructing and remodeling stores for the Company.
In its own words, from its annual report, filed Mar 28, 2025.
Dillard's against its Retail-Department Stores peers
The largest companies of the same SEC industry, each at its latest quarter. Revenue growth: -0.4% against the peers' median +1%. Operating margin: 8.3% against the peers' median 8.1%.
| Company | Quarter | Revenue | Y/Y | Op. margin |
|---|---|---|---|---|
| DDS Dillard's | Q2 FY27 | $1.5B | -0.4% | 8.3% |
| M Macy's | Q2 FY27 | $5.1B | +1% | 4.8% |
| KSS Kohl's | Q2 FY27 | $3.5B | -0.9% | 7.4% |
| BURL Burlington Stores | Q2 FY27 | $3.0B | +11% | 8.1% |
Source: Dillard's 10-Q on SEC EDGAR · CIK 28917 · Retail-Department Stores
13F: who owns DDS and who is buying
More on DDS
History
Every quarter: Q2 FY27 results · Q1 FY27 results · Q4 FY26 results · Q3 FY26 results · Q2 FY26 results · Q1 FY26 results · Q4 FY25 results