Filing Flows › Communication Services › DraftKings (DKNG)
DraftKings (DKNG) earnings and revenue breakdown
Latest: Q3 2026 · 10-Q filed Nov 6, 2026 · DraftKings (DKNG) Q3 2026 earnings results →
Q3 2026 Revenue up 16% year over year to $1.3B · 35¢ of every $1 of revenue lost · operating margin -37.1%
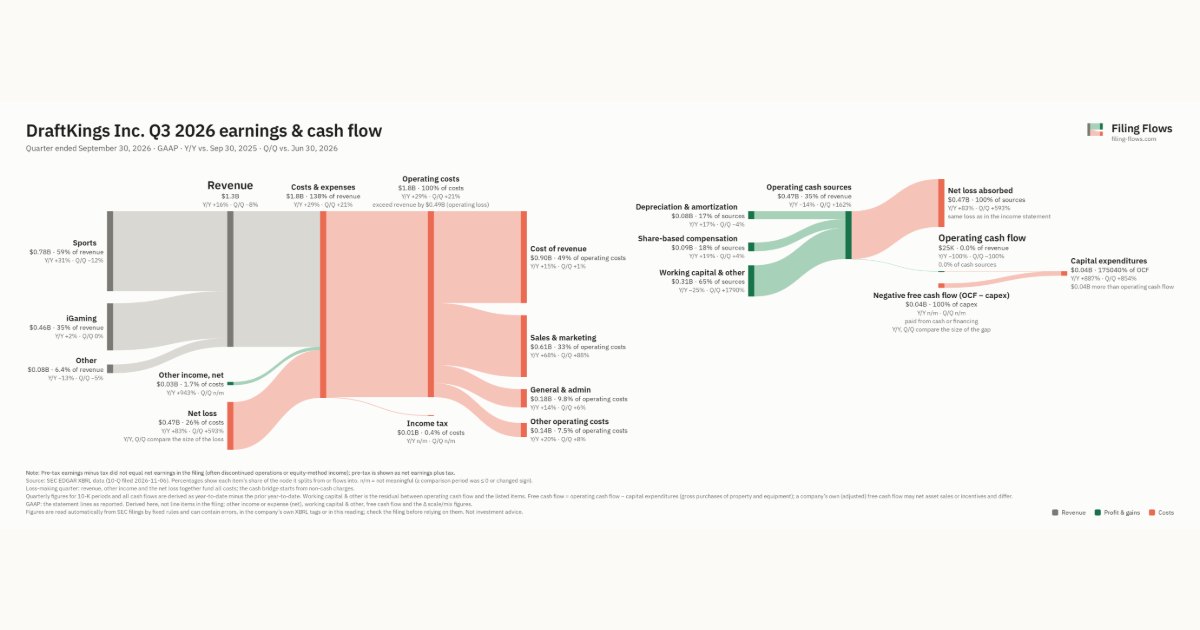
DraftKings made $1.3B in Q3 2026 (+16% Y/Y): Sports $784M, iGaming $461M, Other $84.5M. Operating margin -37.1%, net loss $469M. See where every dollar goes — costs, profit and cash — as a Sankey from the 10-Q filed Nov 6, 2026.
Drawing the Sankey…
Open the interactive Sankey → click any line for what the company wrote about it, compare Y/Y and Q/Q, export as PNG or PDF
What changed this quarter
Revenue was $1.3B in Q3 2026, up 16% year over year and down 8% from the previous quarter. Sports was the largest line at 59% of revenue. Sports added $0.19B year over year (up 31%), 101% of the total change. Other declined 13%.
Operating costs exceeded revenue by $0.49B, an operating margin of -37.1%. Total costs grew 29% against revenue growth of 16%. The fastest-growing cost line was Sales & marketing (+68%). The quarter ended with a net loss of $0.47B, wider than the previous quarter's $0.07B loss.
Operating cash flow was $25K (down 100% year over year). Non-cash charges added back $0.08B of depreciation and amortization and $0.09B of share-based compensation. Working capital and other items added $0.31B. Capital expenditures of $0.04B exceeded it, leaving free cash flow of −$0.04B.
Quarterly history
| Quarter | Form | Filed | Revenue | Y/Y | Op. margin | Net earnings | Op. cash flow |
|---|---|---|---|---|---|---|---|
| Q3 2026 | 10-Q | Nov 6, 2026 | $1.3B | +16% | -37.1% | −$469M | $25K |
| Q2 2026 | 10-Q | Aug 7, 2026 | $1.4B | -5% | -4.7% | −$67.6M | $111M |
| Q1 2026 | 10-Q | May 8, 2026 | $1.6B | +17% | 0.4% | $21.1M | −$48.4M |
| Q4 2025 | 10-K | Feb 13, 2026 | $2.0B | +43% | 7.6% | $136M | $320M |
| Q3 2025 | 10-Q | Nov 7, 2025 | $1.1B | +4% | -23.8% | −$257M | $287M |
| Q2 2025 | 10-Q | Aug 7, 2025 | $1.5B | +37% | 10.0% | $158M | $174M |
| Q1 2025 | 10-Q | May 9, 2025 | $1.4B | +20% | -3.3% | −$33.9M | −$119M |
Charts
Interactive views
The same charts as the app — open one to draw it.
💵Where each $1 goesinteractive
Loading the interactive chart…
🌏Named in Asian annual reportsinteractive
Loading the interactive chart…
🔄Rotation against the market and its industry (RRG)interactive
Loading the interactive chart…
🔍Earnings qualityinteractive
Loading the interactive chart…
⚖️Fair value by methodinteractive
Loading the interactive chart…
🔭Outlook & guidanceinteractive
Loading the interactive chart…
📈Investments: gains and what it boughtinteractive
Loading the interactive chart…
🏭Its industry’s money flow (input-output)interactive
Loading the interactive chart…
Customers and suppliers named in filings
Buys from
About DraftKings
We are a digital sports entertainment and gaming company. We provide users with online and retail sports betting (together, “Sportsbook”), online casino (“iGaming”), daily fantasy sports (“DFS”), digital lottery courier, prediction markets and other product offerings. Our mission is to make life more exciting by responsibly creating the world’s favorite real-money games, betting experiences and event contracts trading. We accomplish this by creating an environment where our users can find enjoyment and fulfillment through Sportsbook, iGaming, DFS, digital lottery courier and prediction markets as well as other product offerings. We are also highly focused on our responsibility as a steward of this new era in real-money gaming.
In its own words, from its 10-K, filed Feb 13, 2026.
DraftKings against its Services-Miscellaneous Amusement & Recreation peers
The largest companies of the same SEC industry, each at its latest quarter. Revenue growth: +16% against the peers' median +7%. Operating margin: -37.1% against the peers' median 4.5%.
| Company | Quarter | Revenue | Y/Y | Op. margin |
|---|---|---|---|---|
| DKNG DraftKings | Q3 2026 | $1.3B | +16% | -37.1% |
| DIS Walt Disney | Q3 FY26 | $25.2B | +7% | 22.0% |
| STUB StubHub Holdings | Q2 2026 | $573M | +33% | 3.4% |
| PRKS United Parks & Resorts | Q3 2026 | $506M | -1% | 27.8% |
| RSI Rush Street Interactive | Q3 2026 | $386M | +39% | 11.1% |
| MTN Vail Resorts | Q4 FY26 | $278M | +2% | -75.1% |
| PRSU Pursuit Attractions & Hospitality | Q3 2026 | $252M | +4% | 45.0% |
| MSGE Madison Square Garden Entertainment | Q1 FY27 | $217M | +37% | 4.5% |
| SEAT Vivid Seats | Q2 2026 | $104M | -9% | -13.8% |
Source: DraftKings 10-Q on SEC EDGAR · CIK 1883685 · Services-Miscellaneous Amusement & Recreation
Guidance and outlook
13F: who owns DKNG and who is buying
More on DKNG
History
Every quarter: Q3 2026 results · Q2 2026 results · Q1 2026 results · Q4 2025 results · Q3 2025 results · Q2 2025 results · Q1 2025 results