Filing Flows › Communication Services › Walt Disney (DIS)
Walt Disney (DIS) earnings and revenue breakdown
Latest: Q3 FY26 · 10-Q filed Aug 5, 2026 · Walt Disney (DIS) Q3 FY26 earnings results →
Q3 FY26 Revenue up 7% year over year to $25.2B · 10¢ of every $1 of revenue kept as net profit · operating margin 22.0%
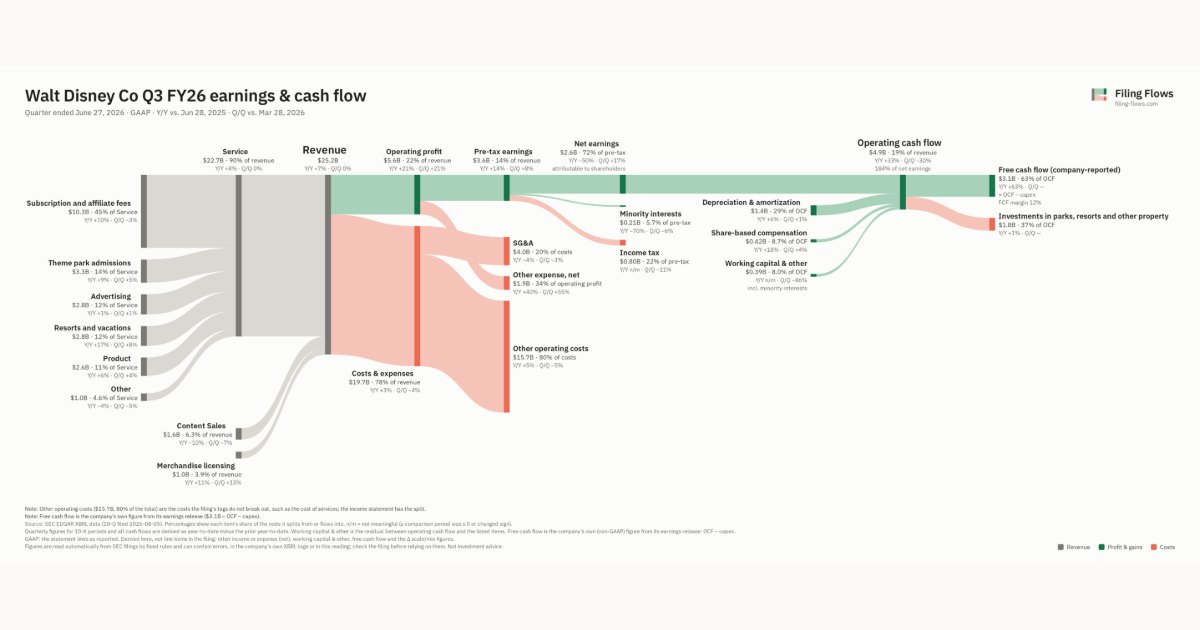
Walt Disney made $25.2B in Q3 FY26 (+7% Y/Y): Service $22.7B, Content Sales $1.6B, Merchandise licensing $974M. Operating margin 22.0%, net earnings $2.6B. See where every dollar goes — costs, profit and cash — as a Sankey from the 10-Q filed Aug 5, 2026.
Drawing the Sankey…
Open the interactive Sankey → click any line for what the company wrote about it, compare Y/Y and Q/Q, export as PNG or PDF
What changed this quarter
Revenue was $25.2B in Q3 FY26, up 7% year over year and roughly flat from the previous quarter. Subscription and affiliate fees was the largest line at 41% of revenue. Subscription and affiliate fees added $0.91B year over year (up 10%), 57% of the total change. Content Sales declined 10%.
Operating profit was $5.6B, a 22.0% margin (up 2.7 points year over year). Of the extra revenue versus Q3 FY25, 61% reached operating profit, above the 19% margin then. Total costs grew 3% against revenue growth of 7%. Net earnings were $2.6B, down 50% year over year. The effective tax rate was 22.0%.
Operating cash flow was $4.9B (up 33% year over year), 171% of net income including minority interests. Non-cash charges added back $1.4B of depreciation and amortization and $0.42B of share-based compensation. After investments in parks, resorts and other property ($1.8B), free cash flow as the company reports it was $3.1B.
Quarterly history
| Quarter | Form | Filed | Revenue | Y/Y | Op. margin | Net earnings | Op. cash flow |
|---|---|---|---|---|---|---|---|
| Q3 FY26 | 10-Q | Aug 5, 2026 | $25.2B | +7% | 22.0% | $2.6B | $4.9B |
| Q2 FY26 | 10-Q | May 6, 2026 | $25.2B | +6% | 18.3% | $2.2B | $6.9B |
| Q1 FY26 | 10-Q | Feb 2, 2026 | $26.0B | +5% | 17.7% | $2.4B | $735M |
| Q4 FY25 | 10-K | Nov 13, 2025 | $22.5B | -0.5% | 15.5% | $1.3B | $4.5B |
| Q3 FY25 | 10-Q | Aug 6, 2025 | $23.6B | +2% | 19.3% | $5.3B | $3.7B |
| Q2 FY25 | 10-Q | May 7, 2025 | $23.6B | +7% | 18.8% | $3.3B | $6.8B |
| Q4 FY24 | 10-K | Nov 14, 2024 | $22.6B | +6% | 16.2% | $460M | $5.5B |
Charts
Interactive views
The same charts as the app — open one to draw it.
💵Where each $1 goesinteractive
Loading the interactive chart…
🌏Named in Asian annual reportsinteractive
Loading the interactive chart…
🔄Rotation against the market and its industry (RRG)interactive
Loading the interactive chart…
🔍Earnings qualityinteractive
Loading the interactive chart…
⚖️Fair value by methodinteractive
Loading the interactive chart…
🔭Outlook & guidanceinteractive
Loading the interactive chart…
📈Investments: gains and what it boughtinteractive
Loading the interactive chart…
🏭Its industry’s money flow (input-output)interactive
Loading the interactive chart…
Customers and suppliers named in filings
Buys from
- CRWS — 23% of the supplier’s revenue · Stated in 10-K (sentence) · source
- HST — 2% of the supplier’s revenue · Stated in 10-K (sentence) · source
About Walt Disney
The Walt Disney Company, together with the subsidiaries through which businesses are conducted (the Company), is a diversified worldwide entertainment company with operations in three segments: Entertainment, Sports and Experiences. The terms “Company”, “we”, “our” and “us” are used in this report to refer collectively to the parent company and the subsidiaries through which businesses are conducted.
In its own words, from its 10-K, filed Nov 13, 2025.
Walt Disney against its Services-Miscellaneous Amusement & Recreation peers
The largest companies of the same SEC industry, each at its latest quarter. Revenue growth: +7% against the peers' median +7%. Operating margin: 22.0% against the peers' median 4.5%.
| Company | Quarter | Revenue | Y/Y | Op. margin |
|---|---|---|---|---|
| DIS Walt Disney | Q3 FY26 | $25.2B | +7% | 22.0% |
| DKNG DraftKings | Q3 2026 | $1.3B | +16% | -37.1% |
| STUB StubHub Holdings | Q2 2026 | $573M | +33% | 3.4% |
| PRKS United Parks & Resorts | Q3 2026 | $506M | -1% | 27.8% |
| RSI Rush Street Interactive | Q3 2026 | $386M | +39% | 11.1% |
| MTN Vail Resorts | Q4 FY26 | $278M | +2% | -75.1% |
| PRSU Pursuit Attractions & Hospitality | Q3 2026 | $252M | +4% | 45.0% |
| MSGE Madison Square Garden Entertainment | Q1 FY27 | $217M | +37% | 4.5% |
| SEAT Vivid Seats | Q2 2026 | $104M | -9% | -13.8% |
Source: Walt Disney 10-Q on SEC EDGAR · CIK 1744489 · Services-Miscellaneous Amusement & Recreation
Guidance and outlook
13F: who owns DIS and who is buying
More on DIS
- How Walt Disney makes money: revenue by segment
- Walt Disney next earnings date and what analysts expect
- Walt Disney stock forecast, price target and fair value
- Who owns Walt Disney stock: holders, funds and Congress trades
- Walt Disney guidance and outlook
- Is Walt Disney a takeover target? LBO and rumors
- Walt Disney recalls, complaints and regulation
History
Every quarter: Q3 FY26 results · Q2 FY26 results · Q1 FY26 results · Q4 FY25 results · Q3 FY25 results · Q2 FY25 results · Q4 FY24 results
- Walt Disney guidance history: guided vs reported
- Walt Disney operating margin by quarter
- Walt Disney net income by quarter
- Walt Disney free cash flow by quarter
- Walt Disney capital expenditures by quarter
- Walt Disney Service revenue by quarter
- Walt Disney Content Sales revenue by quarter
- Walt Disney Merchandise licensing revenue by quarter