Filing Flows › Industrials › Dover (DOV)
Dover (DOV) earnings and revenue breakdown
Latest: Q3 2026 · 10-Q filed Oct 22, 2026 · Dover (DOV) Q3 2026 earnings results →
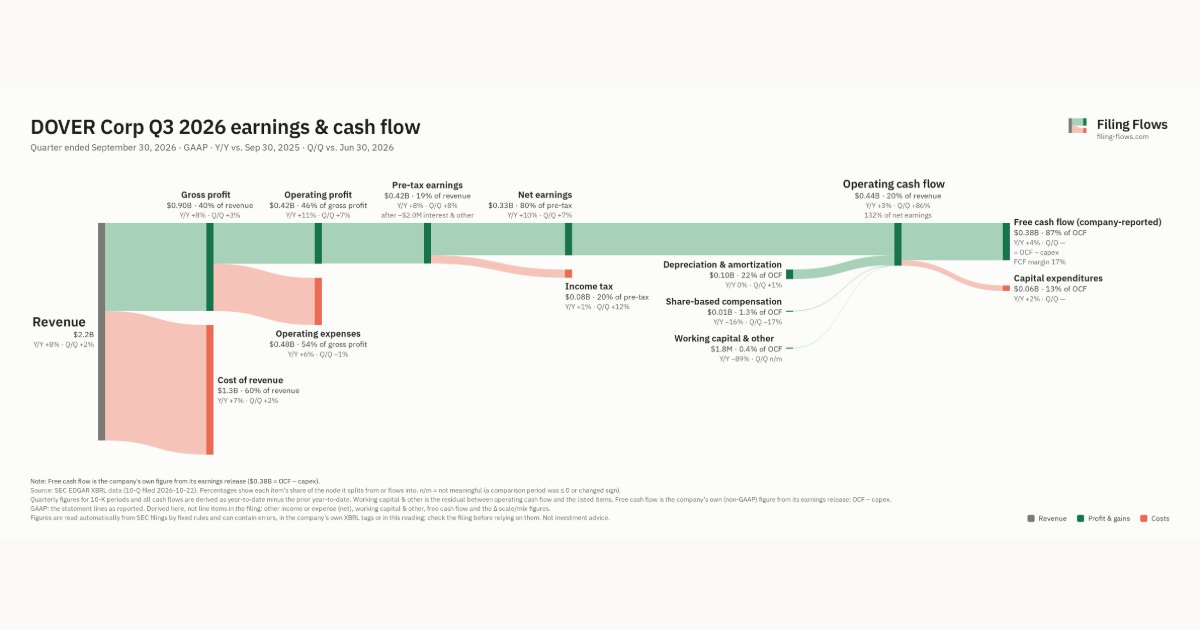
Q3 2026 Revenue up 8% year over year to $2.2B · 15¢ of every $1 of revenue kept as net profit · operating margin 18.8%
Dover made $2.2B in Q3 2026 (+8% Y/Y). Operating margin 18.8%, net earnings $333M. See where every dollar goes — costs, profit and cash — as a Sankey from the 10-Q filed Oct 22, 2026.
Drawing the Sankey…
Open the interactive Sankey → click any line for what the company wrote about it, compare Y/Y and Q/Q, export as PNG or PDF
What changed this quarter
Revenue was $2.2B in Q3 2026, up 8% year over year and up 2% from the previous quarter.
Gross margin was 40.4%, up 0.3 points from Q3 2025. Operating profit was $0.42B, a 18.8% margin (up 0.6 points year over year). Of the extra revenue versus Q3 2025, 27% reached operating profit, above the 18% margin then. Operating expenses grew 6% against revenue growth of 8%. Net earnings were $0.33B, up 10% year over year. The effective tax rate was 20.1%.
Operating cash flow was $0.44B (up 3% year over year), 132% of net earnings. Non-cash charges added back $0.10B of depreciation and amortization and $0.01B of share-based compensation. After capital expenditures ($0.06B), free cash flow as the company reports it was $0.38B.
Quarterly history
| Quarter | Form | Filed | Revenue | Y/Y | Op. margin | Net earnings | Op. cash flow |
|---|---|---|---|---|---|---|---|
| Q3 2026 | 10-Q | Oct 22, 2026 | $2.2B | +8% | 18.8% | $333M | $439M |
| Q2 2026 | 10-Q | Jul 23, 2026 | $2.2B | +7% | 17.9% | $312M | $236M |
| Q1 2026 | 10-Q | Apr 23, 2026 | $2.1B | +10% | 14.9% | $238M | $191M |
| Q4 2025 | 10-K | Feb 13, 2026 | $2.1B | +9% | 16.5% | $282M | $544M |
| Q3 2025 | 10-Q | Oct 23, 2025 | $2.1B | +5% | 18.2% | $302M | $424M |
| Q2 2025 | 10-Q | Jul 24, 2025 | $2.0B | +5% | 17.3% | $279M | $212M |
| Q1 2025 | 10-Q | Apr 24, 2025 | $1.9B | -0.9% | 15.9% | $231M | $157M |
Charts
Interactive views
The same charts as the app — open one to draw it.
💵Where each $1 goesinteractive
Loading the interactive chart…
🌏Named in Asian annual reportsinteractive
Loading the interactive chart…
🔄Rotation against the market and its industry (RRG)interactive
Loading the interactive chart…
🔍Earnings qualityinteractive
Loading the interactive chart…
⚖️Fair value by methodinteractive
Loading the interactive chart…
🔭Outlook & guidanceinteractive
Loading the interactive chart…
📈Investments: gains and what it boughtinteractive
Loading the interactive chart…
🏭Its industry’s money flow (input-output)interactive
Loading the interactive chart…
About Dover
Dover Corporation is a diversified global manufacturer and solutions provider delivering innovative equipment and components, consumable supplies, aftermarket parts, software and digital solutions and support services through five operating segments: Engineered Products, Clean Energy & Fueling, Imaging & Identification, Pumps & Process Solutions, and Climate & Sustainability Technologies. Unless the context indicates otherwise, references herein to "Dover," "the Company," and words such as "we," "us," or "our" include Dover Corporation and its consolidated subsidiaries. Dover was incorporated in 1947 in the State of Delaware and became a publicly traded company in 1955. Dover is headquartered in Downers Grove, Illinois and currently employs approximately 24,000 people worldwide.
In its own words, from its 10-K, filed Feb 13, 2026.
Source: Dover 10-Q on SEC EDGAR · CIK 29905 · Construction, Mining & Materials Handling Machinery & Equip
13F: who owns DOV and who is buying
More on DOV
History
Every quarter: Q3 2026 results · Q2 2026 results · Q1 2026 results · Q4 2025 results · Q3 2025 results · Q2 2025 results · Q1 2025 results