Filing Flows › Materials › DOW (DOW)
DOW (DOW) earnings and revenue breakdown
Latest: Q3 2026 · 10-Q filed Oct 23, 2026 · DOW (DOW) Q3 2026 earnings results →
Q3 2026 Revenue up 13% year over year to $11.3B · 4¢ of every $1 of revenue kept as net profit · operating margin 5.7%
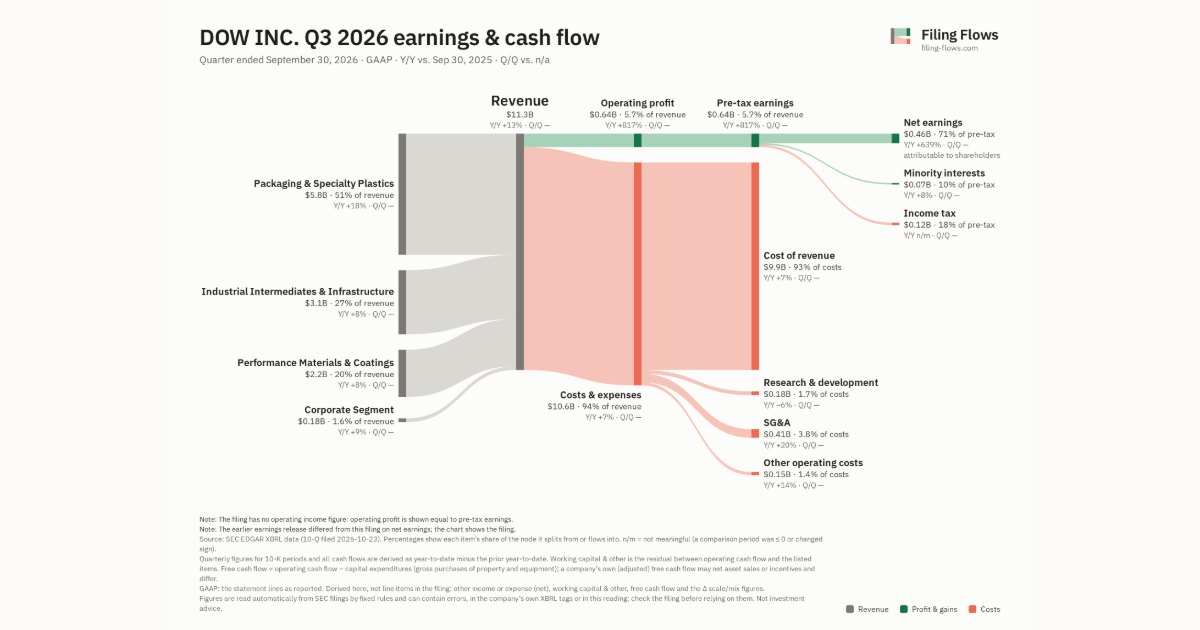
DOW made $11.3B in Q3 2026 (+13% Y/Y): Packaging & Specialty Plastics $5.8B, Industrial Intermediates & Infrastructure $3.1B, Performance Materials & Coatings $2.2B. Operating margin 5.7%, net earnings $458M. See where every dollar goes — costs, profit and cash — as a Sankey from the 10-Q filed Oct 23, 2026.
Drawing the Sankey…
Open the interactive Sankey → click any line for what the company wrote about it, compare Y/Y and Q/Q, export as PNG or PDF
What changed this quarter
Revenue was $11.3B in Q3 2026, up 13% year over year. Packaging & Specialty Plastics was the largest line at 51% of revenue. Packaging & Specialty Plastics added $0.89B year over year (up 18%), 69% of the total change.
Operating profit was $0.64B, a 5.7% margin (up 5.0 points year over year). Of the extra revenue versus a year earlier, 44% reached operating profit, above the 1% margin then. Total costs grew 7% against revenue growth of 13%. The fastest-growing cost line was SG&A (+20%). Net earnings were $0.46B, up 639% year over year. The effective tax rate was 18.2%.
Operating cash flow was $1.8B (up 63% year over year), 350% of net income including minority interests. Non-cash charges added back $0.67B of depreciation and amortization. Working capital and other items added $0.65B. Capital expenditures of $0.71B left free cash flow of $1.1B.
Quarterly history
| Quarter | Form | Filed | Revenue | Y/Y | Op. margin | Net earnings | Op. cash flow |
|---|---|---|---|---|---|---|---|
| Q3 2026 | 10-Q | Oct 23, 2026 | $11.3B | +13% | 5.7% | $458M | $1.8B |
| Q2 2026 | 10-Q | Jul 24, 2026 | $12.1B | +20% | 7.2% | $721M | $1.3B |
| Q1 2026 | 10-Q | Apr 24, 2026 | $9.8B | -6% | -4.0% | −$445M | $1.1B |
| Q2 2025 | 10-Q | Jul 25, 2025 | $10.1B | -7% | -6.5% | −$801M | −$470M |
Charts
Interactive views
The same charts as the app — open one to draw it.
💵Where each $1 goesinteractive
Loading the interactive chart…
🌏Named in Asian annual reportsinteractive
Loading the interactive chart…
🔄Rotation against the market and its industry (RRG)interactive
Loading the interactive chart…
🔍Earnings qualityinteractive
Loading the interactive chart…
⚖️Fair value by methodinteractive
Loading the interactive chart…
🔭Outlook & guidanceinteractive
Loading the interactive chart…
📈Investments: gains and what it boughtinteractive
Loading the interactive chart…
🏭Its industry’s money flow (input-output)interactive
Loading the interactive chart…
About DOW
Dow (NYSE: DOW) is one of the world’s leading materials science companies, serving customers in high-growth markets such as packaging, infrastructure, mobility and consumer applications. Our global breadth, asset integration and scale, customer-focused innovation and leading business positions enable us to achieve profitable growth and help deliver a sustainable future. We operate manufacturing sites in 29 countries and employed approximately 34,600 people as of year-end 2025. Dow delivered sales of approximately $40 billion in 2025. References to Dow or the Company mean Dow Inc. and its subsidiaries. Learn more about us at www.dow.com .
In its own words, from its 8-K, filed Jul 23, 2026.
DOW against its Plastic Materials, Synth Resins & Nonvulcan Elastomers peers
The largest companies of the same SEC industry, each at its latest quarter. Revenue growth: +13% against the peers' median +10%. Operating margin: 5.7% against the peers' median 9.3%.
| Company | Quarter | Revenue | Y/Y | Op. margin |
|---|---|---|---|---|
| DOW DOW | Q3 2026 | $11.3B | +13% | 5.7% |
| DOW Chemical | Q2 2026 | $12.1B | +20% | 7.2% |
| EMN Eastman Chemical | Q3 2026 | $2.4B | +8% | 10.4% |
| DD DuPont de Nemours | Q3 2026 | $1.9B | +4% | 12.5% |
| ALB Albemarle | Q3 2026 | $1.6B | +19% | 9.5% |
| AVNT Avient | Q3 2026 | $891M | +10% | 9.3% |
| TSEOQ Trinseo | Q2 2026 | $845M | +8% | 0.0% |
| HXL Hexcel | Q3 2026 | $496M | +9% | 11.0% |
| ASIX AdvanSix | Q3 2026 | $431M | +15% | -2.6% |
Source: DOW 10-Q on SEC EDGAR · CIK 1751788 · Plastic Materials, Synth Resins & Nonvulcan Elastomers
Guidance and outlook
13F: who owns DOW and who is buying
More on DOW
History
Every quarter: Q3 2026 results · Q2 2026 results · Q1 2026 results · Q2 2025 results