Filing Flows › Materials › Albemarle (ALB)
Albemarle (ALB) earnings and revenue breakdown
Latest: Q3 2026 · 10-Q filed Nov 4, 2026 · Albemarle (ALB) Q3 2026 earnings results →
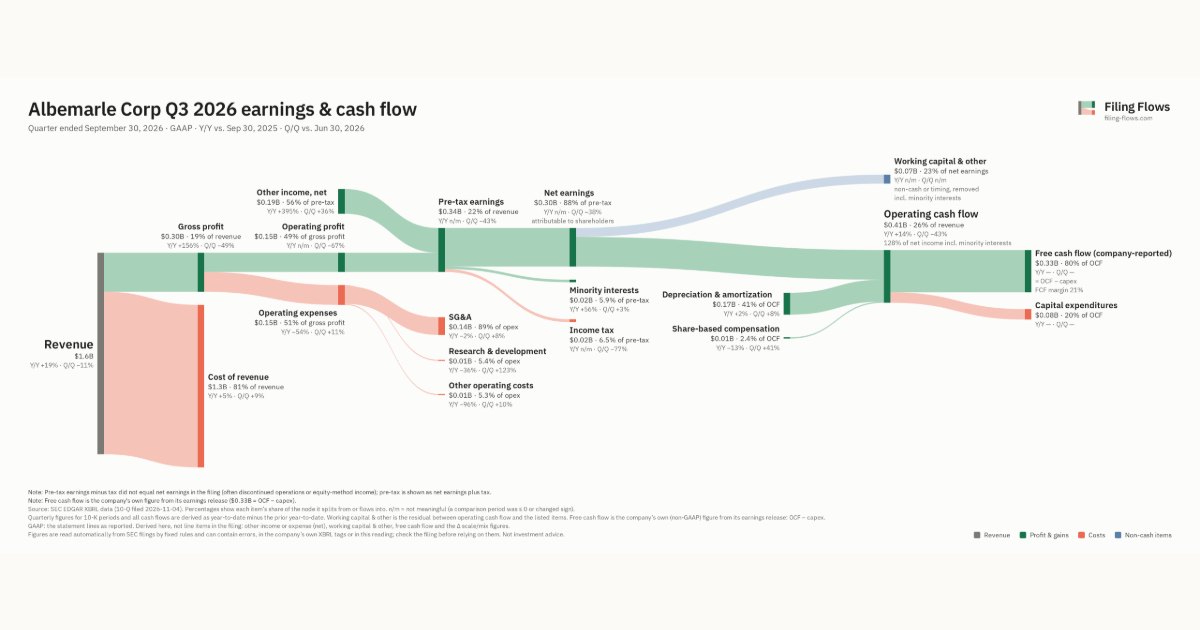
Q3 2026 Revenue up 19% year over year to $1.6B · 19¢ of every $1 of revenue kept as net profit · operating margin 9.5%
Albemarle made $1.6B in Q3 2026 (+19% Y/Y). Operating margin 9.5%, net earnings $297M. See where every dollar goes — costs, profit and cash — as a Sankey from the 10-Q filed Nov 4, 2026.
Drawing the Sankey…
Open the interactive Sankey → click any line for what the company wrote about it, compare Y/Y and Q/Q, export as PNG or PDF
What changed this quarter
Revenue was $1.6B in Q3 2026, up 19% year over year and down 11% from the previous quarter.
Gross margin was 19.4%, up 10.4 points from Q3 2025. Operating profit was $0.15B, a 9.5% margin (up 26.1 points year over year). Operating expenses fell 54% while revenue rose 19%. Net earnings were $0.30B. The effective tax rate was 6.5%. Non-operating items added $0.19B, 56% of pre-tax earnings, so the bottom line overstates operating performance.
Operating cash flow was $0.41B (up 14% year over year), 128% of net income including minority interests. Non-cash charges added back $0.17B of depreciation and amortization and $0.01B of share-based compensation. Working capital and other items used $0.09B. After capital expenditures ($0.08B), free cash flow as the company reports it was $0.33B.
Quarterly history
| Quarter | Form | Filed | Revenue | Y/Y | Op. margin | Net earnings | Op. cash flow |
|---|---|---|---|---|---|---|---|
| Q3 2026 | 10-Q | Nov 4, 2026 | $1.6B | +19% | 9.5% | $297M | $406M |
| Q2 2026 | 10-Q | Aug 5, 2026 | $1.7B | +31% | 26.0% | $480M | $710M |
| Q1 2026 | 10-Q | May 6, 2026 | $1.4B | +33% | 16.3% | $319M | $346M |
| Q4 2025 | 10-K | Feb 11, 2026 | $1.4B | +16% | -15.2% | −$402M | $388M |
| Q3 2025 | 10-Q | Nov 5, 2025 | $1.3B | -4% | -16.6% | −$148M | $356M |
| Q2 2025 | 10-Q | Aug 4, 2025 | $1.3B | -7% | 3.6% | $22.9M | −$9.0M |
| Q1 2025 | 10-Q | Apr 30, 2025 | $1.1B | -21% | 1.8% | $41.3M | $547M |
Charts
In supply chains and themes
Interactive views
The same charts as the app — open one to draw it.
💵Where each $1 goesinteractive
Loading the interactive chart…
🌏Named in Asian annual reportsinteractive
Loading the interactive chart…
🔄Rotation against the market and its industry (RRG)interactive
Loading the interactive chart…
🔍Earnings qualityinteractive
Loading the interactive chart…
⚖️Fair value by methodinteractive
Loading the interactive chart…
🔭Outlook & guidanceinteractive
Loading the interactive chart…
📈Investments: gains and what it boughtinteractive
Loading the interactive chart…
🏭Its industry’s money flow (input-output)interactive
Loading the interactive chart…
About Albemarle
Albemarle Corporation (NYSE: ALB) is a world leader in transforming essential resources into critical ingredients for mobility, energy, connectivity and health. We partner to pioneer new ways to move, power, connect and protect with people and planet in mind. A reliable and high-quality global supply of lithium and bromine allows us to deliver advanced solutions for our customers. Learn more about how the people of Albemarle are enabling a more resilient world at Albemarle.com. Albemarle regularly posts information to Albemarle.com, including notification of events, news, financial performance, investor presentations and webcasts, non-GAAP reconciliations, U.S. Securities and Exchange Commission filings and other information regarding the company, its businesses and the markets it serves.
In its own words, from its 8-K, filed Aug 5, 2026.
Albemarle against its Plastic Materials, Synth Resins & Nonvulcan Elastomers peers
The largest companies of the same SEC industry, each at its latest quarter. Revenue growth: +19% against the peers' median +10%. Operating margin: 9.5% against the peers' median 9.3%.
| Company | Quarter | Revenue | Y/Y | Op. margin |
|---|---|---|---|---|
| ALB Albemarle | Q3 2026 | $1.6B | +19% | 9.5% |
| DOW Chemical | Q2 2026 | $12.1B | +20% | 7.2% |
| DOW DOW | Q3 2026 | $11.3B | +13% | 5.7% |
| EMN Eastman Chemical | Q3 2026 | $2.4B | +8% | 10.4% |
| DD DuPont de Nemours | Q3 2026 | $1.9B | +4% | 12.5% |
| AVNT Avient | Q3 2026 | $891M | +10% | 9.3% |
| TSEOQ Trinseo | Q2 2026 | $845M | +8% | 0.0% |
| HXL Hexcel | Q3 2026 | $496M | +9% | 11.0% |
| ASIX AdvanSix | Q3 2026 | $431M | +15% | -2.6% |
Source: Albemarle 10-Q on SEC EDGAR · CIK 915913 · Plastic Materials, Synth Resins & Nonvulcan Elastomers
Guidance and outlook
13F: who owns ALB and who is buying
More on ALB
- How Albemarle makes money: revenue by segment
- Albemarle next earnings date and what analysts expect
- Albemarle stock forecast, price target and fair value
- Who owns Albemarle stock: holders, funds and Congress trades
- Albemarle guidance and outlook
- Is Albemarle a takeover target? LBO and rumors
- Albemarle recalls, complaints and regulation
History
Every quarter: Q3 2026 results · Q2 2026 results · Q1 2026 results · Q4 2025 results · Q3 2025 results · Q2 2025 results · Q1 2025 results