Filing Flows › Materials › DuPont de Nemours (DD)
DuPont de Nemours (DD) earnings and revenue breakdown
Latest: Q3 2026 · 10-Q filed Nov 3, 2026 · DuPont de Nemours (DD) Q3 2026 earnings results →
Q3 2026 Revenue up 4% year over year to $1.9B · 7¢ of every $1 of revenue kept as net profit · operating margin 12.5%
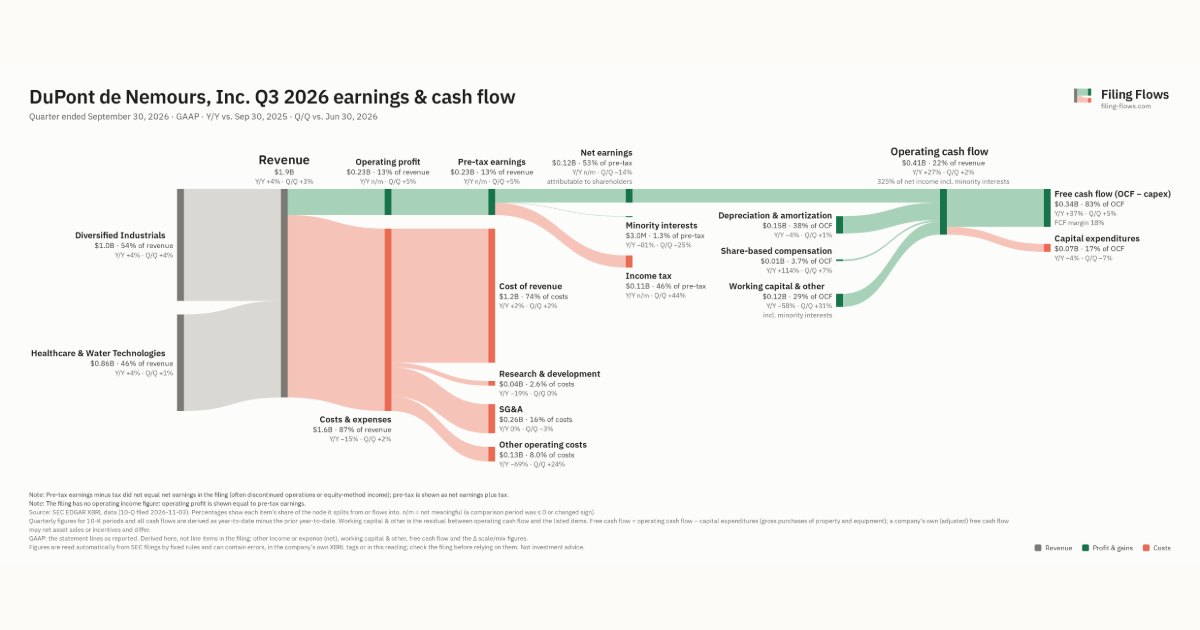
DuPont de Nemours made $1.9B in Q3 2026 (+4% Y/Y): Diversified Industrials $1.0B, Healthcare & Water Technologies $865M. Operating margin 12.5%, net earnings $123M. See where every dollar goes — costs, profit and cash — as a Sankey from the 10-Q filed Nov 3, 2026.
Drawing the Sankey…
Open the interactive Sankey → click any line for what the company wrote about it, compare Y/Y and Q/Q, export as PNG or PDF
What changed this quarter
Revenue was $1.9B in Q3 2026, up 4% year over year and up 3% from the previous quarter. Diversified Industrials was the largest line at 54% of revenue. Diversified Industrials added $0.04B year over year (up 4%), 55% of the total change.
Operating profit was $0.23B, a 12.5% margin (up 19.1 points year over year). Total costs fell 15% while revenue rose 4%. Net earnings were $0.12B. The effective tax rate was 46.2%.
Operating cash flow was $0.41B (up 27% year over year), 325% of net income including minority interests. Non-cash charges added back $0.15B of depreciation and amortization and $0.01B of share-based compensation. Working capital and other items added $0.11B. Capital expenditures of $0.07B left free cash flow of $0.34B.
Quarterly history
| Quarter | Form | Filed | Revenue | Y/Y | Op. margin | Net earnings | Op. cash flow |
|---|---|---|---|---|---|---|---|
| Q3 2026 | 10-Q | Nov 3, 2026 | $1.9B | +4% | 12.5% | $123M | $410M |
| Q2 2026 | 10-Q | Aug 4, 2026 | $1.8B | +4% | 12.2% | $143M | $400M |
| Q1 2026 | 10-Q | May 5, 2026 | $1.7B | +4% | 11.6% | $161M | $232M |
| Q4 2025 | 10-K | Feb 17, 2026 | $1.7B | +0.2% | -12.3% | −$120M | −$700M |
| Q3 2025 | 10-Q | Nov 6, 2025 | $3.1B | +7% | -2.9% | −$107M | $497M |
| Q2 2025 | 10-Q | Aug 5, 2025 | $3.3B | +3% | 4.2% | $59.0M | $381M |
| Q1 2025 | 10-Q | May 2, 2025 | $3.1B | +5% | -15.1% | −$581M | $382M |
Charts
Interactive views
The same charts as the app — open one to draw it.
💵Where each $1 goesinteractive
Loading the interactive chart…
🌏Named in Asian annual reportsinteractive
Loading the interactive chart…
🔄Rotation against the market and its industry (RRG)interactive
Loading the interactive chart…
🔍Earnings qualityinteractive
Loading the interactive chart…
⚖️Fair value by methodinteractive
Loading the interactive chart…
🔭Outlook & guidanceinteractive
Loading the interactive chart…
📈Investments: gains and what it boughtinteractive
Loading the interactive chart…
🏭Its industry’s money flow (input-output)interactive
Loading the interactive chart…
About DuPont de Nemours
Throughout this Annual Report on Form 10-K, except as otherwise noted by the context, the terms "DuPont" or "Company" used herein mean DuPont de Nemours, Inc. and its consolidated subsidiaries. DuPont is a leading provider of advanced solutions that improve everyday life across healthcare, water, construction and industrial markets. The Company is committed to helping customers advance their technology pipelines and provide solutions that address their unique challenges. From delivering clean water to enabling medical packaging solutions which enhance safety and performance, DuPont's innovations power the essential products and technologies people rely on every day. At December 31, 2025, the Company has subsidiaries in about 50 countries worldwide and manufacturing operations in about 20 countries.
In its own words, from its 10-K, filed Feb 17, 2026.
DuPont de Nemours against its Plastic Materials, Synth Resins & Nonvulcan Elastomers peers
The largest companies of the same SEC industry, each at its latest quarter. Revenue growth: +4% against the peers' median +10%. Operating margin: 12.5% against the peers' median 9.3%.
| Company | Quarter | Revenue | Y/Y | Op. margin |
|---|---|---|---|---|
| DD DuPont de Nemours | Q3 2026 | $1.9B | +4% | 12.5% |
| DOW Chemical | Q2 2026 | $12.1B | +20% | 7.2% |
| DOW DOW | Q3 2026 | $11.3B | +13% | 5.7% |
| EMN Eastman Chemical | Q3 2026 | $2.4B | +8% | 10.4% |
| ALB Albemarle | Q3 2026 | $1.6B | +19% | 9.5% |
| AVNT Avient | Q3 2026 | $891M | +10% | 9.3% |
| TSEOQ Trinseo | Q2 2026 | $845M | +8% | 0.0% |
| HXL Hexcel | Q3 2026 | $496M | +9% | 11.0% |
| ASIX AdvanSix | Q3 2026 | $431M | +15% | -2.6% |
Source: DuPont de Nemours 10-Q on SEC EDGAR · CIK 1666700 · Plastic Materials, Synth Resins & Nonvulcan Elastomers
Guidance and outlook
13F: who owns DD and who is buying
More on DD
- How DuPont de Nemours makes money: revenue by segment
- DuPont de Nemours next earnings date and what analysts expect
- DuPont de Nemours stock forecast, price target and fair value
- Who owns DuPont de Nemours stock: holders, funds and Congress trades
- DuPont de Nemours guidance and outlook
- DuPont de Nemours recalls, complaints and regulation
History
Every quarter: Q3 2026 results · Q2 2026 results · Q1 2026 results · Q4 2025 results · Q3 2025 results · Q2 2025 results · Q1 2025 results
- DuPont de Nemours guidance history: guided vs reported
- DuPont de Nemours operating margin by quarter
- DuPont de Nemours net income by quarter
- DuPont de Nemours free cash flow by quarter
- DuPont de Nemours R&D spending by quarter
- DuPont de Nemours capital expenditures by quarter
- DuPont de Nemours Diversified Industrials revenue by quarter
- DuPont de Nemours Healthcare & Water Technologies revenue by quarter