Filing Flows › Consumer Staples › Ecolab (ECL)
Ecolab (ECL) earnings and revenue breakdown
Latest: Q3 2026 · 10-Q filed Oct 29, 2026 · Ecolab (ECL) Q3 2026 earnings results →
Q3 2026 Revenue up 13% year over year to $4.7B · 12¢ of every $1 of revenue kept as net profit · operating margin 17.3%
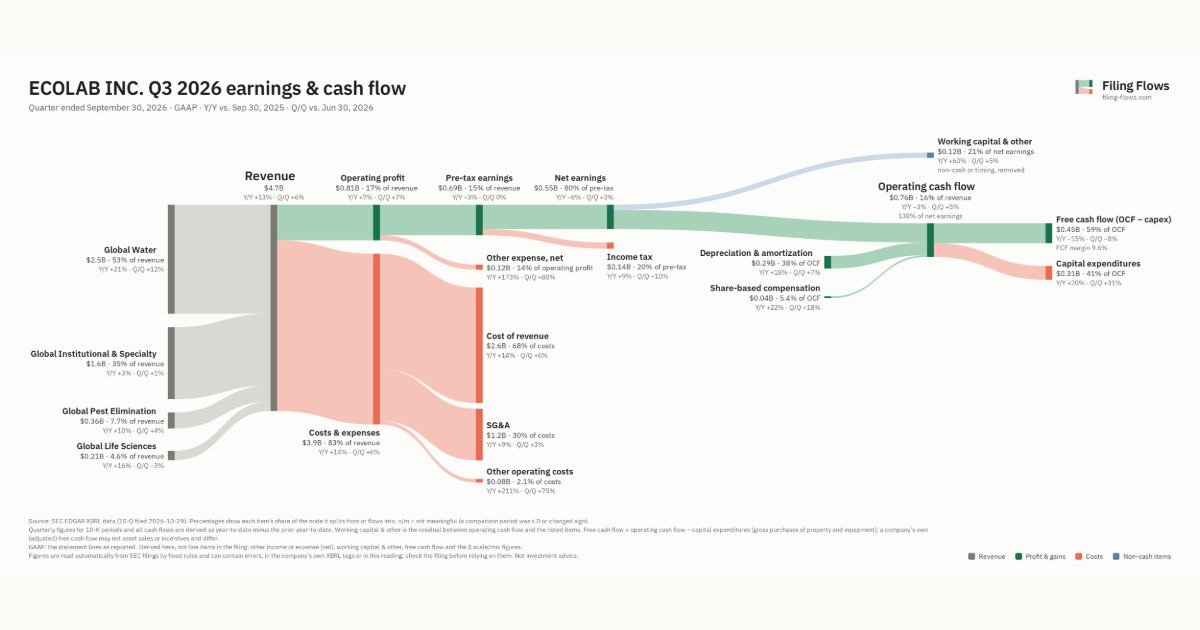
Ecolab made $4.7B in Q3 2026 (+13% Y/Y): Global Water $2.5B, Global Institutional & Specialty $1.6B, Global Pest Elimination $364M. Operating margin 17.3%, net earnings $551M. See where every dollar goes — costs, profit and cash — as a Sankey from the 10-Q filed Oct 29, 2026.
Drawing the Sankey…
Open the interactive Sankey → click any line for what the company wrote about it, compare Y/Y and Q/Q, export as PNG or PDF
What changed this quarter
Revenue was $4.7B in Q3 2026, up 13% year over year and up 6% from the previous quarter. Global Water was the largest line at 53% of revenue. Global Water added $0.43B year over year (up 21%), 80% of the total change.
Operating profit was $0.81B, a 17.3% margin (down 1.0 points year over year). Of the extra revenue versus Q3 2025, 9% reached operating profit, below the 18% margin then. Total costs grew 14% against revenue growth of 13%. The fastest-growing cost line was Other operating costs (+211%). Net earnings were $0.55B, down 6% year over year. The effective tax rate was 20.2%.
Operating cash flow was $0.76B (down 3% year over year), 138% of net earnings. Non-cash charges added back $0.29B of depreciation and amortization and $0.04B of share-based compensation. Working capital and other items used $0.12B. Capital expenditures of $0.31B left free cash flow of $0.45B.
Quarterly history
| Quarter | Form | Filed | Revenue | Y/Y | Op. margin | Net earnings | Op. cash flow |
|---|---|---|---|---|---|---|---|
| Q3 2026 | 10-Q | Oct 29, 2026 | $4.7B | +13% | 17.3% | $551M | $764M |
| Q2 2026 | 10-Q | Aug 6, 2026 | $4.4B | +10% | 17.2% | $535M | $730M |
| Q1 2026 | 10-Q | May 7, 2026 | $4.1B | +10% | 15.3% | $433M | $446M |
| Q4 2025 | 10-K | Feb 23, 2026 | $4.2B | +5% | 17.0% | $564M | $1.1B |
| Q3 2025 | 10-Q | Oct 30, 2025 | $4.2B | +4% | 18.3% | $585M | $791M |
| Q2 2025 | 10-Q | Aug 7, 2025 | $4.0B | +1% | 17.6% | $524M | $702M |
| Q1 2025 | 10-Q | May 8, 2025 | $3.7B | -2% | 15.0% | $402M | $369M |
Charts
Interactive views
The same charts as the app — open one to draw it.
💵Where each $1 goesinteractive
Loading the interactive chart…
🌏Named in Asian annual reportsinteractive
Loading the interactive chart…
🔄Rotation against the market and its industry (RRG)interactive
Loading the interactive chart…
🔍Earnings qualityinteractive
Loading the interactive chart…
⚖️Fair value by methodinteractive
Loading the interactive chart…
🔭Outlook & guidanceinteractive
Loading the interactive chart…
📈Investments: gains and what it boughtinteractive
Loading the interactive chart…
🏭Its industry’s money flow (input-output)interactive
Loading the interactive chart…
About Ecolab
Ecolab was incorporated as a Delaware corporation in 1924. Our fiscal year is the calendar year ending December 31. International subsidiaries are included in the consolidated financial statements on the basis of their U.S. GAAP (accounting principles generally accepted in the United States of America) November 30 fiscal year ends to facilitate the timely inclusion of such entities in our consolidated financial reporting. A trusted partner for millions of customers, we are a global leader in water, hygiene and infection prevention solutions and services that protect people and the resources vital to life. For more than a century, we have advanced innovation by integrating science-based solutions, data-driven insights, AI-technology and world-class service.
In its own words, from its 10-K, filed Feb 23, 2026.
Ecolab against its Soap, Detergents, Cleang Preparations, Perfumes, Cosmetics peers
The largest companies of the same SEC industry, each at its latest quarter. Revenue growth: +13% against the peers' median +13%. Operating margin: 17.3% against the peers' median 17.3%.
| Company | Quarter | Revenue | Y/Y | Op. margin |
|---|---|---|---|---|
| ECL Ecolab | Q3 2026 | $4.7B | +13% | 17.3% |
| PG Procter & Gamble | Q1 FY27 | $23.3B | +4% | 25.5% |
| CHD Church & Dwight | Q3 2026 | $1.6B | +1% | 18.2% |
| SCL Stepan | Q3 2026 | $692M | +17% | 3.8% |
| XAGE Longevity Health Holdings | Q2 2026 | $396K | -21% | -182.9% |
| ORIB Orion Bliss | Q1 FY27 | $12K | +300% | -32.0% |
Source: Ecolab 10-Q on SEC EDGAR · CIK 31462 · Soap, Detergents, Cleang Preparations, Perfumes, Cosmetics
13F: who owns ECL and who is buying
More on ECL
History
Every quarter: Q3 2026 results · Q2 2026 results · Q1 2026 results · Q4 2025 results · Q3 2025 results · Q2 2025 results · Q1 2025 results