Filing Flows › Consumer Staples › Church & Dwight (CHD)
Church & Dwight (CHD) earnings and revenue breakdown
Latest: Q3 2026 · 10-Q filed Oct 30, 2026 · Church & Dwight (CHD) Q3 2026 earnings results →
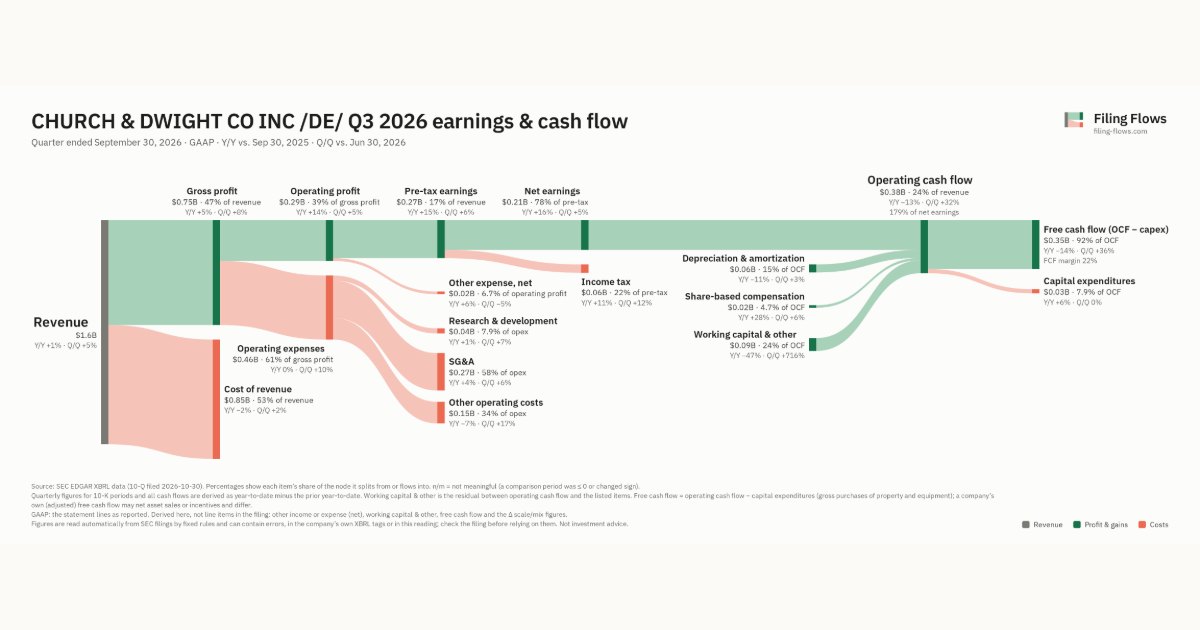
Q3 2026 Revenue up 1% year over year to $1.6B · 13¢ of every $1 of revenue kept as net profit · operating margin 18.2%
Church & Dwight made $1.6B in Q3 2026 (+1% Y/Y). Operating margin 18.2%, net earnings $212M. See where every dollar goes — costs, profit and cash — as a Sankey from the 10-Q filed Oct 30, 2026.
Drawing the Sankey…
Open the interactive Sankey → click any line for what the company wrote about it, compare Y/Y and Q/Q, export as PNG or PDF
What changed this quarter
Revenue was $1.6B in Q3 2026, up 1% year over year and up 5% from the previous quarter.
Gross margin was 46.8%, up 1.7 points from Q3 2025. Operating profit was $0.29B, a 18.2% margin (up 2.1 points year over year). Of the extra revenue versus Q3 2025, 223% reached operating profit, above the 16% margin then. Operating expenses fell 0% while revenue rose 1%. Net earnings were $0.21B, up 16% year over year. The effective tax rate was 22.0%.
Operating cash flow was $0.38B (down 13% year over year), 179% of net earnings. Non-cash charges added back $0.06B of depreciation and amortization and $0.02B of share-based compensation. Working capital and other items added $0.09B. Capital expenditures of $0.03B left free cash flow of $0.35B.
Quarterly history
| Quarter | Form | Filed | Revenue | Y/Y | Op. margin | Net earnings | Op. cash flow |
|---|---|---|---|---|---|---|---|
| Q3 2026 | 10-Q | Oct 30, 2026 | $1.6B | +1% | 18.2% | $212M | $380M |
| Q2 2026 | 10-Q | Jul 31, 2026 | $1.5B | +2% | 18.1% | $203M | $287M |
| Q1 2026 | 10-Q | May 1, 2026 | $1.5B | +0.1% | 19.8% | $216M | $175M |
| Q4 2025 | 10-K | Feb 12, 2026 | $1.6B | +4% | 16.2% | $144M | $363M |
| Q3 2025 | 10-Q | Oct 31, 2025 | $1.6B | +5% | 16.1% | $182M | $436M |
| Q2 2025 | 10-Q | Aug 1, 2025 | $1.5B | -0.3% | 17.4% | $191M | $231M |
| Q1 2025 | 10-Q | May 1, 2025 | $1.5B | -2% | 20.1% | $220M | $186M |
Charts
Interactive views
The same charts as the app — open one to draw it.
💵Where each $1 goesinteractive
Loading the interactive chart…
🌏Named in Asian annual reportsinteractive
Loading the interactive chart…
🔄Rotation against the market and its industry (RRG)interactive
Loading the interactive chart…
🔍Earnings qualityinteractive
Loading the interactive chart…
⚖️Fair value by methodinteractive
Loading the interactive chart…
🔭Outlook & guidanceinteractive
Loading the interactive chart…
📈Investments: gains and what it boughtinteractive
Loading the interactive chart…
🏭Its industry’s money flow (input-output)interactive
Loading the interactive chart…
Customers and suppliers named in filings
Sells to
About Church & Dwight
Church & Dwight Co., Inc. (NYSE: CHD) founded in 1846, is the leading U.S. producer of sodium bicarbonate, popularly known as baking soda. The Company manufactures and markets a wide range of personal care, household, and specialty products under recognized brand names such as ARM & HAMMER ® , TROJAN ® , OXICLEAN ® , FIRST RESPONSE ® , NAIR ® , ORAJEL ® , XTRA ® , BATISTE ® , WATERPIK ® , ZICAM ® , THERABREATH ® , HERO ® , TOUCHLAND ® and MISS MOUTH’S ® . For more information, visit the Company’s website.
In its own words, from its 8-K, filed Jul 31, 2026.
Church & Dwight against its Soap, Detergents, Cleang Preparations, Perfumes, Cosmetics peers
The largest companies of the same SEC industry, each at its latest quarter. Revenue growth: +1% against the peers' median +13%. Operating margin: 18.2% against the peers' median 17.3%.
| Company | Quarter | Revenue | Y/Y | Op. margin |
|---|---|---|---|---|
| CHD Church & Dwight | Q3 2026 | $1.6B | +1% | 18.2% |
| PG Procter & Gamble | Q1 FY27 | $23.3B | +4% | 25.5% |
| ECL Ecolab | Q3 2026 | $4.7B | +13% | 17.3% |
| SCL Stepan | Q3 2026 | $692M | +17% | 3.8% |
| XAGE Longevity Health Holdings | Q2 2026 | $396K | -21% | -182.9% |
| ORIB Orion Bliss | Q1 FY27 | $12K | +300% | -32.0% |
Source: Church & Dwight 10-Q on SEC EDGAR · CIK 313927 · Soap, Detergents, Cleang Preparations, Perfumes, Cosmetics
Guidance and outlook
13F: who owns CHD and who is buying
More on CHD
- How Church & Dwight makes money: revenue by segment
- Church & Dwight next earnings date and what analysts expect
- Church & Dwight stock forecast, price target and fair value
- Who owns Church & Dwight stock: holders, funds and Congress trades
- Church & Dwight guidance and outlook
- Is Church & Dwight a takeover target? LBO and rumors
- Church & Dwight recalls, complaints and regulation
History
Every quarter: Q3 2026 results · Q2 2026 results · Q1 2026 results · Q4 2025 results · Q3 2025 results · Q2 2025 results · Q1 2025 results