Filing Flows › Technology › Flex (FLEX)
Flex (FLEX) earnings and revenue breakdown
Latest: Q2 FY27 · 10-Q filed Oct 30, 2026 · Flex (FLEX) Q2 FY27 earnings results →
Q2 FY27 Revenue up 25% year over year to $8.5B · 3¢ of every $1 of revenue kept as net profit · operating margin 4.9%
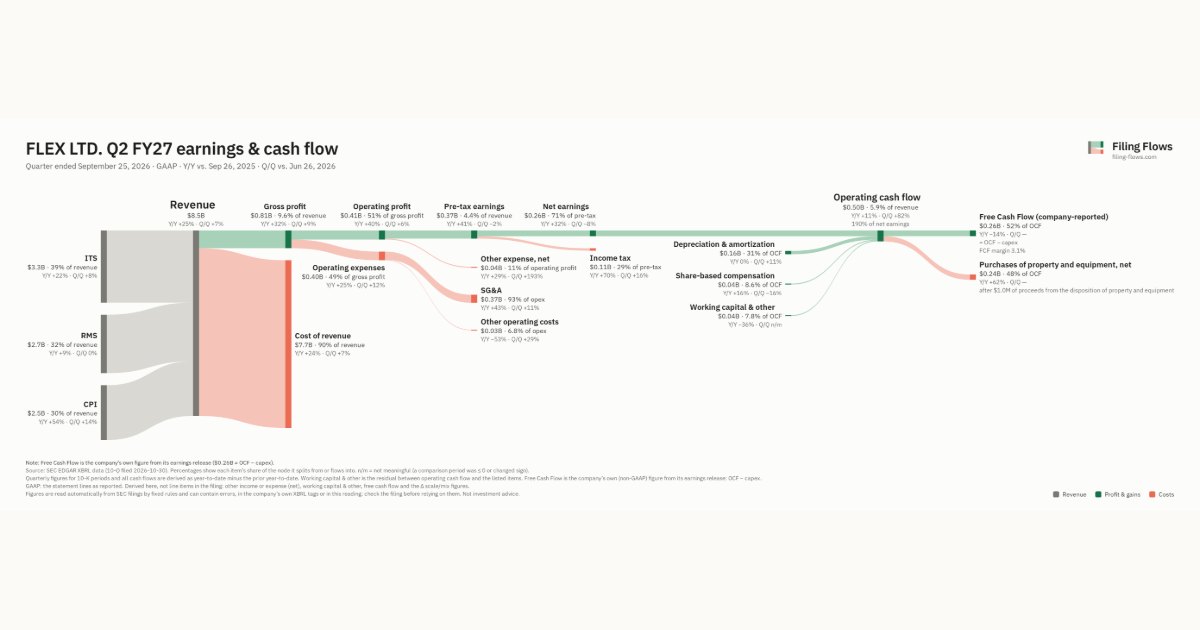
Flex made $8.5B in Q2 FY27 (+25% Y/Y): ITS $3.3B, RMS $2.7B, CPI $2.5B. Operating margin 4.9%, net earnings $263M. See where every dollar goes — costs, profit and cash — as a Sankey from the 10-Q filed Oct 30, 2026.
Drawing the Sankey…
Open the interactive Sankey → click any line for what the company wrote about it, compare Y/Y and Q/Q, export as PNG or PDF
What changed this quarter
Revenue was $8.5B in Q2 FY27, up 25% year over year and up 7% from the previous quarter. ITS was the largest line at 39% of revenue. CPI added $0.88B year over year (up 54%), 52% of the total change.
Gross margin was 9.6%, up 0.5 points from Q2 FY26. Operating profit was $0.41B, a 4.9% margin (up 0.5 points year over year). Of the extra revenue versus Q2 FY26, 7% reached operating profit, above the 4% margin then. Operating expenses grew 25% against revenue growth of 25%. The fastest-growing cost line was SG&A (+43%). Net earnings were $0.26B, up 32% year over year. The effective tax rate was 28.9%.
Operating cash flow was $0.50B (up 11% year over year), 190% of net earnings. Non-cash charges added back $0.16B of depreciation and amortization and $0.04B of share-based compensation. Working capital and other items added $0.04B. After purchases of property and equipment, net ($0.24B), free cash flow as the company reports it was $0.26B.
Quarterly history
| Quarter | Form | Filed | Revenue | Y/Y | Op. margin | Net earnings | Op. cash flow |
|---|---|---|---|---|---|---|---|
| Q2 FY27 | 10-Q | Oct 30, 2026 | $8.5B | +25% | 4.9% | $263M | $501M |
| Q1 FY27 | 10-Q | Jul 31, 2026 | $7.9B | +21% | 4.9% | $285M | $276M |
| Q4 FY26 | 10-K | May 20, 2026 | $7.5B | +17% | 5.0% | $250M | $413M |
| Q3 FY26 | 10-Q | Feb 6, 2026 | $7.1B | +8% | 5.5% | $239M | $420M |
| Q2 FY26 | 10-Q | Oct 31, 2025 | $6.8B | +4% | 4.4% | $199M | $453M |
| Q1 FY26 | 10-Q | Jul 25, 2025 | $6.6B | +4% | 4.7% | $192M | $399M |
| Q4 FY25 | 10-K | May 21, 2025 | $6.4B | +4% | 4.8% | $222M | $433M |
Charts
Interactive views
The same charts as the app — open one to draw it.
💵Where each $1 goesinteractive
Loading the interactive chart…
🌏Named in Asian annual reportsinteractive
Loading the interactive chart…
🔄Rotation against the market and its industry (RRG)interactive
Loading the interactive chart…
🔍Earnings qualityinteractive
Loading the interactive chart…
⚖️Fair value by methodinteractive
Loading the interactive chart…
🔭Outlook & guidanceinteractive
Loading the interactive chart…
📈Investments: gains and what it boughtinteractive
Loading the interactive chart…
🏭Its industry’s money flow (input-output)interactive
Loading the interactive chart…
Customers and suppliers named in filings
Sells to
About Flex
Flex is the advanced, end-to-end manufacturing partner of choice that helps a diverse customer base design, build, deliver and manage products that improve the world. Through the collective strength of a global workforce across approximately 30 countries with responsible, sustainable operations, we deliver technology innovation, supply chain, and manufacturing solutions to diverse industries and end markets. The Company’s full suite of specialized capabilities includes design and engineering, supply chain, manufacturing, and integrated services, plus a portfolio of power and cooling products. Over time, we have built differentiated scale and expertise across both technology-driven and regulated markets, enabling us to support customers with increasingly complex product, infrastructure, and compliance requirements.
In its own words, from its 10-K, filed May 20, 2026.
Flex against its Printed Circuit Boards peers
The largest companies of the same SEC industry, each at its latest quarter. Revenue growth: +25% against the peers' median +29%. Operating margin: 4.9% against the peers' median 6.0%.
| Company | Quarter | Revenue | Y/Y | Op. margin |
|---|---|---|---|---|
| FLEX Flex | Q2 FY27 | $8.5B | +25% | 4.9% |
| JBL Jabil | Q4 FY26 | $10.6B | +29% | 5.7% |
| CLS Celestica | Q3 2026 | $5.8B | +82% | 7.9% |
| SANM Sanmina | Q3 FY26 | $3.5B | +70% | 6.4% |
| PLXS Plexus | Q4 FY26 | $1.4B | +35% | 6.0% |
| TTMI TTM Technologies | Q3 2026 | $1.2B | +60% | 13.5% |
| BHE Benchmark Electronics | Q3 2026 | $811M | +19% | 3.8% |
| KE Kimball Electronics | Q1 FY27 | $391M | +7% | 3.2% |
| CTS CTS | Q3 2026 | $150M | +5% | 17.1% |
Source: Flex 10-Q on SEC EDGAR · CIK 866374 · Printed Circuit Boards
Guidance and outlook
More on FLEX
History
Every quarter: Q2 FY27 results · Q1 FY27 results · Q4 FY26 results · Q3 FY26 results · Q2 FY26 results · Q1 FY26 results · Q4 FY25 results