Filing Flows › Technology › Jabil (JBL)
Jabil (JBL) earnings and revenue breakdown
Latest: Q4 FY26 · 10-K filed Oct 23, 2026 · Jabil (JBL) Q4 FY26 earnings results →
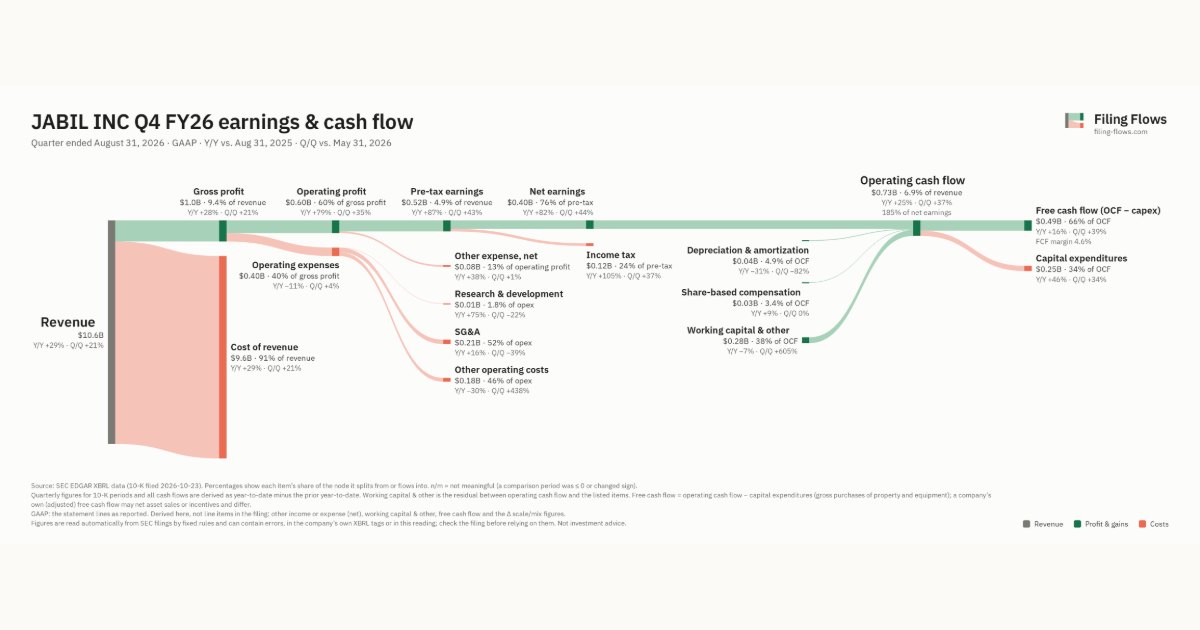
Q4 FY26 Revenue up 29% year over year to $10.6B · 4¢ of every $1 of revenue kept as net profit · operating margin 5.7%
Jabil made $10.6B in Q4 FY26 (+29% Y/Y). Operating margin 5.7%, net earnings $397M. See where every dollar goes — costs, profit and cash — as a Sankey from the 10-K filed Oct 23, 2026.
Drawing the Sankey…
Open the interactive Sankey → click any line for what the company wrote about it, compare Y/Y and Q/Q, export as PNG or PDF
What changed this quarter
Revenue was $10.6B in Q4 FY26, up 29% year over year and up 21% from the previous quarter.
Gross margin was 9.4%, down 0.1 points from Q4 FY25. Operating profit was $0.60B, a 5.7% margin (up 1.6 points year over year). Of the extra revenue versus Q4 FY25, 11% reached operating profit, above the 4% margin then. Operating expenses fell 11% while revenue rose 29%. The fastest-growing cost line was Research & development (+75%). Net earnings were $0.40B, up 83% year over year. The effective tax rate was 23.9%.
Operating cash flow was $0.73B (up 25% year over year), 185% of net earnings. Non-cash charges added back $0.04B of depreciation and amortization and $0.03B of share-based compensation. Working capital and other items added $0.28B. Capital expenditures of $0.25B left free cash flow of $0.49B.
Quarterly history
| Quarter | Form | Filed | Revenue | Y/Y | Op. margin | Net earnings | Op. cash flow |
|---|---|---|---|---|---|---|---|
| Q4 FY26 | 10-K | Oct 23, 2026 | $10.6B | +29% | 5.7% | $397M | $733M |
| Q3 FY26 | 10-Q | Jun 30, 2026 | $8.8B | +12% | 5.1% | $275M | $535M |
| Q2 FY26 | 10-Q | Apr 8, 2026 | $8.3B | +23% | 4.5% | $222M | $411M |
| Q1 FY26 | 10-Q | Jan 9, 2026 | $8.3B | +19% | 3.4% | $146M | $323M |
| Q4 FY25 | 10-K | Oct 17, 2025 | $8.3B | +18% | 4.1% | $218M | $588M |
| Q3 FY25 | 10-Q | Jun 30, 2025 | $7.8B | +16% | 5.1% | $222M | $406M |
| Q2 FY25 | 10-Q | Apr 8, 2025 | $6.7B | -0.6% | 3.6% | $117M | $334M |
Charts
In supply chains and themes
Interactive views
The same charts as the app — open one to draw it.
💵Where each $1 goesinteractive
Loading the interactive chart…
🌏Named in Asian annual reportsinteractive
Loading the interactive chart…
🔄Rotation against the market and its industry (RRG)interactive
Loading the interactive chart…
🔍Earnings qualityinteractive
Loading the interactive chart…
⚖️Fair value by methodinteractive
Loading the interactive chart…
🔭Outlook & guidanceinteractive
Loading the interactive chart…
📈Investments: gains and what it boughtinteractive
Loading the interactive chart…
🏭Its industry’s money flow (input-output)interactive
Loading the interactive chart…
Customers and suppliers named in filings
Sells to
About Jabil
Jabil is one of the leading providers of engineering, supply chain, and manufacturing solutions. We deliver comprehensive design, production, and product management services to companies across a diverse range of industries and end markets. Our capabilities span the entire product lifecycle—from innovation, design, and planning to fabrication, assembly, delivery, and post-production—enabling seamless management of resources and materials across global supply chains. Through these integrated services, we help our customers reduce manufacturing costs, enhance supply chain efficiency, minimize inventory risk, lower transportation expenses, and accelerate product fulfillment.
In its own words, from its 10-K, filed Oct 23, 2026.
Jabil against its Printed Circuit Boards peers
The largest companies of the same SEC industry, each at its latest quarter. Revenue growth: +29% against the peers' median +29%. Operating margin: 5.7% against the peers' median 6.0%.
| Company | Quarter | Revenue | Y/Y | Op. margin |
|---|---|---|---|---|
| JBL Jabil | Q4 FY26 | $10.6B | +29% | 5.7% |
| FLEX Flex | Q2 FY27 | $8.5B | +25% | 4.9% |
| CLS Celestica | Q3 2026 | $5.8B | +82% | 7.9% |
| SANM Sanmina | Q3 FY26 | $3.5B | +70% | 6.4% |
| PLXS Plexus | Q4 FY26 | $1.4B | +35% | 6.0% |
| TTMI TTM Technologies | Q3 2026 | $1.2B | +60% | 13.5% |
| BHE Benchmark Electronics | Q3 2026 | $811M | +19% | 3.8% |
| KE Kimball Electronics | Q1 FY27 | $391M | +7% | 3.2% |
| CTS CTS | Q3 2026 | $150M | +5% | 17.1% |
Source: Jabil 10-K on SEC EDGAR · CIK 898293 · Printed Circuit Boards
Guidance and outlook
13F: who owns JBL and who is buying
More on JBL
History
Every quarter: Q4 FY26 results · Q3 FY26 results · Q2 FY26 results · Q1 FY26 results · Q4 FY25 results · Q3 FY25 results · Q2 FY25 results