Filing Flows › Technology › Sanmina (SANM)
Sanmina (SANM) earnings and revenue breakdown
Latest: Q3 FY26 · 10-Q filed Jul 27, 2026 · Sanmina (SANM) Q3 FY26 earnings results →
Q3 FY26 Revenue up 70% year over year to $3.5B · 3¢ of every $1 of revenue kept as net profit · operating margin 6.4%
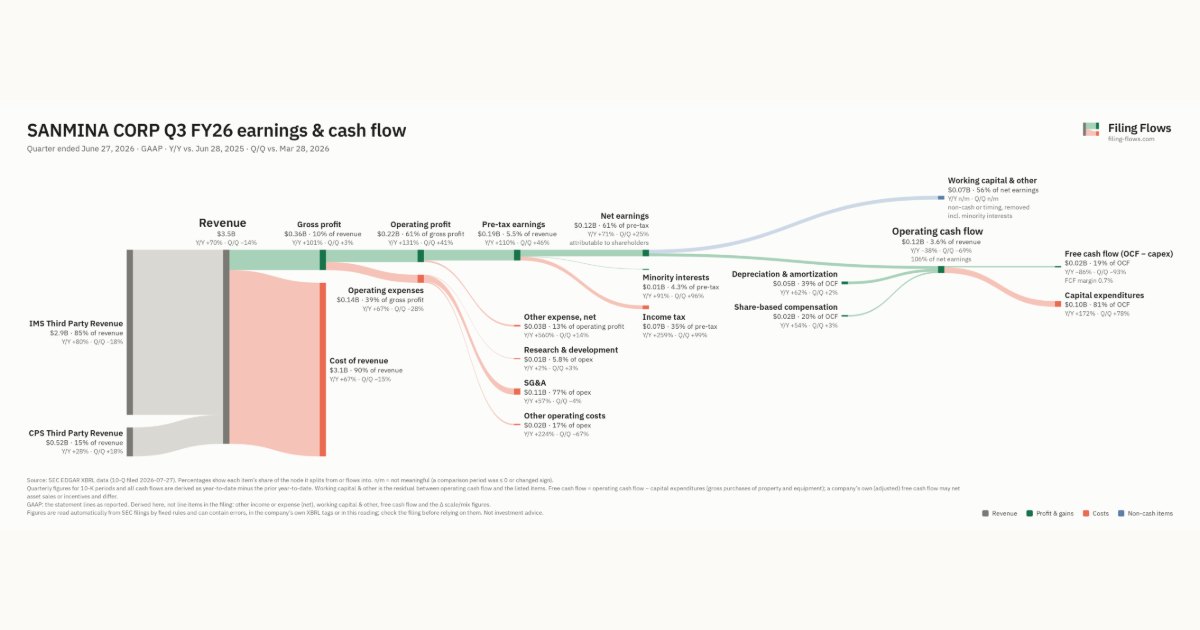
Sanmina made $3.5B in Q3 FY26 (+70% Y/Y): IMS Third Party Revenue $2.9B, CPS Third Party Revenue $516M. Operating margin 6.4%, net earnings $117M. See where every dollar goes — costs, profit and cash — as a Sankey from the 10-Q filed Jul 27, 2026.
Drawing the Sankey…
Open the interactive Sankey → click any line for what the company wrote about it, compare Y/Y and Q/Q, export as PNG or PDF
What changed this quarter
Revenue was $3.5B in Q3 FY26, up 70% year over year and down 14% from the previous quarter. IMS Third Party Revenue was the largest line at 85% of revenue. IMS Third Party Revenue added $1.3B year over year (up 80%), 92% of the total change.
Gross margin was 10.5%, up 1.6 points from Q3 FY25. Operating profit was $0.22B, a 6.4% margin (up 1.7 points year over year). Of the extra revenue versus Q3 FY25, 9% reached operating profit, above the 5% margin then. Operating expenses grew 67% against revenue growth of 70%. The fastest-growing cost line was Other operating costs (+224%). Net earnings were $0.12B, up 71% year over year. The effective tax rate was 34.7%.
Operating cash flow was $0.12B (down 38% year over year), 99% of net income including minority interests. Non-cash charges added back $0.05B of depreciation and amortization and $0.02B of share-based compensation. Working capital and other items used $0.07B. Capital expenditures of $0.10B left free cash flow of $0.02B.
Quarterly history
| Quarter | Form | Filed | Revenue | Y/Y | Op. margin | Net earnings | Op. cash flow |
|---|---|---|---|---|---|---|---|
| Q3 FY26 | 10-Q | Jul 27, 2026 | $3.5B | +70% | 6.4% | $117M | $124M |
| Q2 FY26 | 10-Q | Apr 27, 2026 | $4.0B | +102% | 3.9% | $93.6M | $399M |
| Q1 FY26 | 10-Q | Jan 26, 2026 | $3.2B | +59% | 2.3% | $49.3M | $179M |
| Q4 FY25 | 10-K | Nov 13, 2025 | $2.1B | +4% | 3.7% | $48.1M | $199M |
| Q3 FY25 | 10-Q | Jul 28, 2025 | $2.0B | +11% | 4.7% | $68.6M | $201M |
| Q2 FY25 | 10-Q | Apr 28, 2025 | $2.0B | +8% | 4.6% | $64.2M | $157M |
| Q4 FY24 | 10-K | Nov 27, 2024 | $2.0B | -2% | 4.4% | $61.4M | $51.9M |
Charts
Interactive views
The same charts as the app — open one to draw it.
💵Where each $1 goesinteractive
Loading the interactive chart…
🌏Named in Asian annual reportsinteractive
Loading the interactive chart…
🔄Rotation against the market and its industry (RRG)interactive
Loading the interactive chart…
🔍Earnings qualityinteractive
Loading the interactive chart…
⚖️Fair value by methodinteractive
Loading the interactive chart…
🔭Outlook & guidanceinteractive
Loading the interactive chart…
📈Investments: gains and what it boughtinteractive
Loading the interactive chart…
🏭Its industry’s money flow (input-output)interactive
Loading the interactive chart…
Customers and suppliers named in filings
Sells to
About Sanmina
Sanmina Corporation (“we” or “Sanmina” or the “Company”) is a leading global provider of integrated manufacturing solutions, components, products and repair, logistics and after-market services. We provide these comprehensive offerings primarily to original equipment manufacturers (“OEMs”) in the following industries: industrial, medical, defense and aerospace, automotive, communications networks and cloud infrastructure. Our customer-focused organization with 39,000 employees, including 4,000 temporary employees, supports our customers from 20 countries on four continents. We locate our facilities near our customers and their end markets in major centers for the electronics industry or in lower-cost locations. The combination of our advanced technologies, extensive manufacturing expertise and economies of scale enables us to meet the specialized needs of our customers.
In its own words, from its 10-K, filed Nov 13, 2025.
Sanmina against its Printed Circuit Boards peers
The largest companies of the same SEC industry, each at its latest quarter. Revenue growth: +70% against the peers' median +29%. Operating margin: 6.4% against the peers' median 6.0%.
| Company | Quarter | Revenue | Y/Y | Op. margin |
|---|---|---|---|---|
| SANM Sanmina | Q3 FY26 | $3.5B | +70% | 6.4% |
| JBL Jabil | Q4 FY26 | $10.6B | +29% | 5.7% |
| FLEX Flex | Q2 FY27 | $8.5B | +25% | 4.9% |
| CLS Celestica | Q3 2026 | $5.8B | +82% | 7.9% |
| PLXS Plexus | Q4 FY26 | $1.4B | +35% | 6.0% |
| TTMI TTM Technologies | Q3 2026 | $1.2B | +60% | 13.5% |
| BHE Benchmark Electronics | Q3 2026 | $811M | +19% | 3.8% |
| KE Kimball Electronics | Q1 FY27 | $391M | +7% | 3.2% |
| CTS CTS | Q3 2026 | $150M | +5% | 17.1% |
Source: Sanmina 10-Q on SEC EDGAR · CIK 897723 · Printed Circuit Boards
Guidance and outlook
13F: who owns SANM and who is buying
More on SANM
History
Every quarter: Q3 FY26 results · Q2 FY26 results · Q1 FY26 results · Q4 FY25 results · Q3 FY25 results · Q2 FY25 results · Q4 FY24 results
- Sanmina guidance history: guided vs reported
- Sanmina gross margin by quarter
- Sanmina operating margin by quarter
- Sanmina net income by quarter
- Sanmina free cash flow by quarter
- Sanmina R&D spending by quarter
- Sanmina capital expenditures by quarter
- Sanmina IMS Third Party Revenue revenue by quarter
- Sanmina CPS Third Party Revenue revenue by quarter