Filing Flows › Industrials › TechnipFMC (FTI)
TechnipFMC (FTI) earnings and revenue breakdown
Latest: Q3 2026 · 10-Q filed Oct 29, 2026 · TechnipFMC (FTI) Q3 2026 earnings results →
Q3 2026 Revenue up 9% year over year to $2.9B · 14¢ of every $1 of revenue kept as net profit · operating margin 19.5%
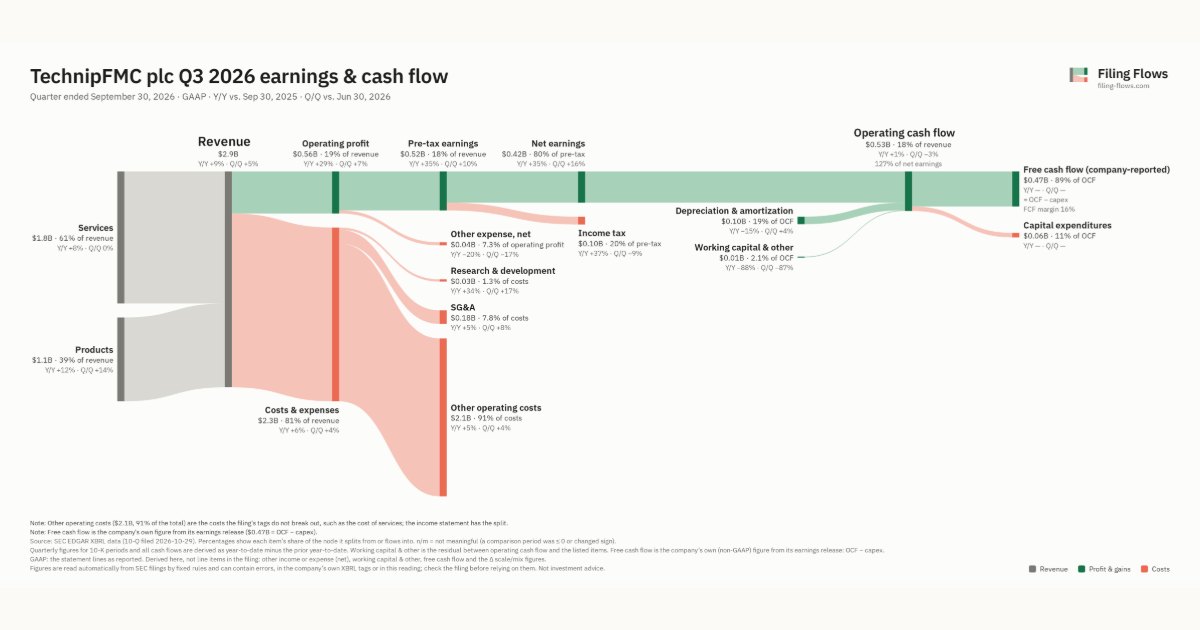
TechnipFMC made $2.9B in Q3 2026 (+9% Y/Y): Services $1.8B, Products $1.1B. Operating margin 19.5%, net earnings $419M. See where every dollar goes — costs, profit and cash — as a Sankey from the 10-Q filed Oct 29, 2026.
Drawing the Sankey…
Open the interactive Sankey → click any line for what the company wrote about it, compare Y/Y and Q/Q, export as PNG or PDF
What changed this quarter
Revenue was $2.9B in Q3 2026, up 9% year over year and up 5% from the previous quarter. Services was the largest line at 61% of revenue. Services added $0.13B year over year (up 8%), 53% of the total change.
Operating profit was $0.56B, a 19.5% margin (up 2.9 points year over year). Of the extra revenue versus Q3 2025, 51% reached operating profit, above the 17% margin then. Total costs grew 6% against revenue growth of 9%. The fastest-growing cost line was Research & development (+34%). Net earnings were $0.42B, up 35% year over year. The effective tax rate was 19.9%.
Operating cash flow was $0.53B (up 1% year over year), 127% of net earnings. Non-cash charges added back $0.10B of depreciation and amortization. After capital expenditures ($0.06B), free cash flow as the company reports it was $0.47B.
Quarterly history
| Quarter | Form | Filed | Revenue | Y/Y | Op. margin | Net earnings | Op. cash flow |
|---|---|---|---|---|---|---|---|
| Q3 2026 | 10-Q | Oct 29, 2026 | $2.9B | +9% | 19.5% | $419M | $531M |
| Q2 2026 | 10-Q | Jul 30, 2026 | $2.8B | +9% | 19.0% | $362M | $548M |
| Q1 2026 | 10-Q | Apr 30, 2026 | $2.5B | +12% | 15.5% | $260M | $332M |
| Q4 2025 | 10-K | Feb 19, 2026 | $2.5B | +6% | 12.6% | $243M | $454M |
| Q3 2025 | 10-Q | Oct 23, 2025 | $2.6B | +13% | 16.5% | $310M | $525M |
| Q2 2025 | 10-Q | Jul 24, 2025 | $2.5B | +9% | 15.9% | $268M | $344M |
| Q1 2025 | 10-Q | Apr 24, 2025 | $2.2B | +9% | 12.5% | $142M | $442M |
Charts
Interactive views
The same charts as the app — open one to draw it.
💵Where each $1 goesinteractive
Loading the interactive chart…
🌏Named in Asian annual reportsinteractive
Loading the interactive chart…
🔄Rotation against the market and its industry (RRG)interactive
Loading the interactive chart…
🔍Earnings qualityinteractive
Loading the interactive chart…
⚖️Fair value by methodinteractive
Loading the interactive chart…
🔭Outlook & guidanceinteractive
Loading the interactive chart…
📈Investments: gains and what it boughtinteractive
Loading the interactive chart…
🏭Its industry’s money flow (input-output)interactive
Loading the interactive chart…
About TechnipFMC
TechnipFMC plc (“TechnipFMC,” the “Company,” “we,” or “our”) is a leading technology provider to the traditional and new energy industries, delivering fully integrated projects, products, and services. With our proprietary technologies and comprehensive solutions, we transform our clients’ project economics, unlocking new possibilities to develop energy resources while reducing carbon intensity and supporting their energy transition ambitions. Organized in two business segments - Subsea and Surface Technologies - we will continue driving change in the energy industry with our pioneering integrated ecosystems, technology leadership, and digital innovation.
In its own words, from its 10-K, filed Feb 19, 2026.
TechnipFMC against its Oil & Gas Field Machinery & Equipment peers
The largest companies of the same SEC industry, each at its latest quarter. Revenue growth: +9% against the peers' median +14%. Operating margin: 19.5% against the peers' median 13.4%.
| Company | Quarter | Revenue | Y/Y | Op. margin |
|---|---|---|---|---|
| FTI TechnipFMC | Q3 2026 | $2.9B | +9% | 19.5% |
| BKR Baker Hughes | Q3 2026 | $8.0B | +14% | 6.5% |
| NOV NOV | Q3 2026 | $2.2B | +2% | 6.4% |
| DNOW Dnow | Q3 2026 | $1.3B | +111% | 2.5% |
| WFRD Weatherford International | Q3 2026 | $1.1B | -7% | 13.4% |
| WHD Cactus | Q3 2026 | $431M | +63% | 21.8% |
| SEI Solaris Energy Infrastructure | Q3 2026 | $341M | +104% | 19.6% |
| INVX Innovex International | Q3 2026 | $265M | +10% | 12.2% |
| FLOC Flowco Holdings | Q3 2026 | $259M | +46% | 18.5% |
Source: TechnipFMC 10-Q on SEC EDGAR · CIK 1681459 · Oil & Gas Field Machinery & Equipment
Guidance and outlook
More on FTI
History
Every quarter: Q3 2026 results · Q2 2026 results · Q1 2026 results · Q4 2025 results · Q3 2025 results · Q2 2025 results · Q1 2025 results