Filing Flows › Industrials › Garmin (GRMN)
Garmin (GRMN) earnings and revenue breakdown
Latest: Q3 2026 · 10-Q filed Oct 28, 2026 · Garmin (GRMN) Q3 2026 earnings results →
Q3 2026 Revenue up 12% year over year to $2.0B · 27¢ of every $1 of revenue kept as net profit · operating margin 30.8%
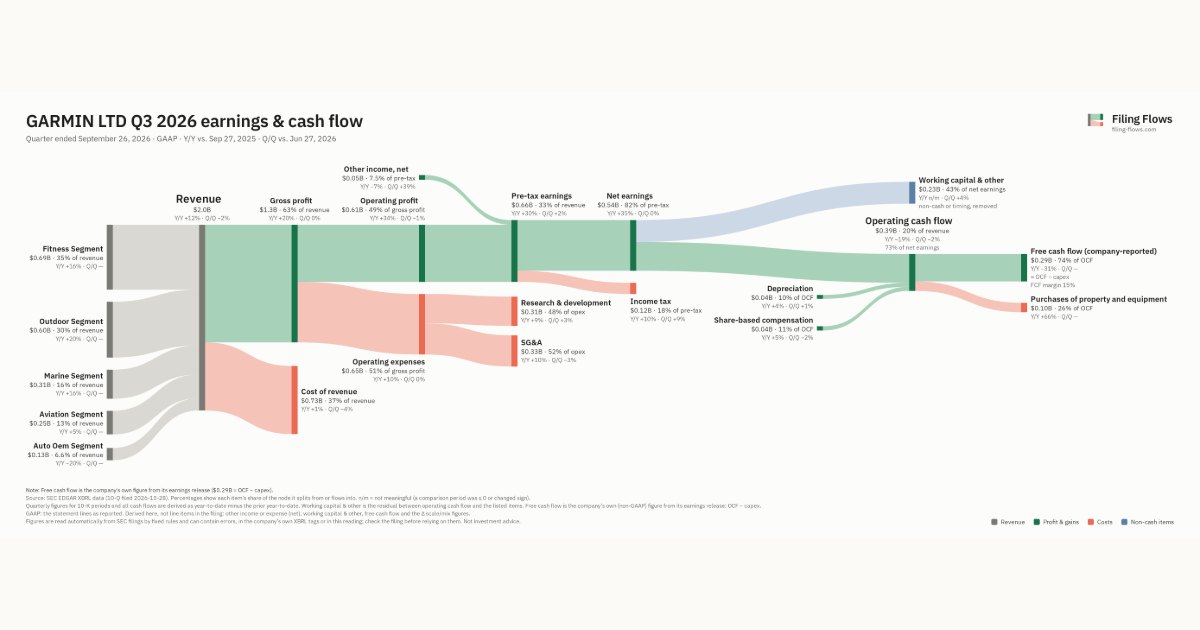
Garmin made $2.0B in Q3 2026 (+12% Y/Y): Fitness Segment $694M, Outdoor Segment $597M, Marine Segment $310M. Operating margin 30.8%, net earnings $542M. See where every dollar goes — costs, profit and cash — as a Sankey from the 10-Q filed Oct 28, 2026.
Drawing the Sankey…
Open the interactive Sankey → click any line for what the company wrote about it, compare Y/Y and Q/Q, export as PNG or PDF
What changed this quarter
Revenue was $2.0B in Q3 2026, up 12% year over year and down 2% from the previous quarter. Fitness Segment was the largest line at 35% of revenue. Outdoor Segment added $0.10B year over year (up 20%), 46% of the total change. Auto Oem Segment declined 20%.
Gross margin was 63.3%, up 4.2 points from Q3 2025. Operating profit was $0.61B, a 30.8% margin (up 5.0 points year over year). Of the extra revenue versus Q3 2025, 72% reached operating profit, above the 26% margin then. Operating expenses grew 10% against revenue growth of 12%. Net earnings were $0.54B, up 35% year over year. The effective tax rate was 18.1%.
Operating cash flow was $0.39B (down 19% year over year), 73% of net earnings. Non-cash charges added back $0.04B of depreciation and $0.04B of share-based compensation. Working capital and other items used $0.23B. After purchases of property and equipment ($0.10B), free cash flow as the company reports it was $0.29B.
Quarterly history
| Quarter | Form | Filed | Revenue | Y/Y | Op. margin | Net earnings | Op. cash flow |
|---|---|---|---|---|---|---|---|
| Q3 2026 | 10-Q | Oct 28, 2026 | $2.0B | +12% | 30.8% | $542M | $394M |
| Q2 2026 | 10-Q | Jul 29, 2026 | $2.0B | +11% | 30.4% | $542M | $404M |
| Q1 2026 | 10-Q | Apr 29, 2026 | $1.8B | +14% | 24.6% | $405M | $536M |
| Q4 2025 | 10-K | Feb 18, 2026 | $2.1B | +17% | 28.9% | $529M | $554M |
| Q3 2025 | 10-Q | Oct 29, 2025 | $1.8B | +12% | 25.8% | $402M | $486M |
| Q2 2025 | 10-Q | Jul 30, 2025 | $1.8B | +20% | 26.0% | $401M | $173M |
| Q1 2025 | 10-Q | Apr 30, 2025 | $1.5B | +11% | 21.7% | $333M | $421M |
Charts
Interactive views
The same charts as the app — open one to draw it.
💵Where each $1 goesinteractive
Loading the interactive chart…
🌏Named in Asian annual reportsinteractive
Loading the interactive chart…
🔄Rotation against the market and its industry (RRG)interactive
Loading the interactive chart…
🔍Earnings qualityinteractive
Loading the interactive chart…
⚖️Fair value by methodinteractive
Loading the interactive chart…
🔭Outlook & guidanceinteractive
Loading the interactive chart…
📈Investments: gains and what it boughtinteractive
Loading the interactive chart…
🏭Its industry’s money flow (input-output)interactive
Loading the interactive chart…
About Garmin
For more than 35 years, Garmin Ltd. and its subsidiaries (collectively, we, our, us, the Company or Garmin) have pioneered new products, many of which feature location technology such as Global Positioning System (GPS), services and applications that are designed for people who live an active lifestyle. Garmin serves five primary markets: fitness, outdoor, aviation, marine, and auto OEM. Garmin designs, develops, manufactures, markets, and distributes a diverse family of GPS-enabled products and other navigation, communications, sensor-based and information products and services for these markets, as well as products installed by original equipment manufacturers (OEMs) and for aftermarket applications. Since the inception of its business, Garmin has delivered over 300 million products, which included more than 20 million products delivered during fiscal 2025.
In its own words, from its 10-K, filed Feb 18, 2026.
Garmin against its Search, Detection, Navigation, Guidance, Aeronautical Sys peers
The largest companies of the same SEC industry, each at its latest quarter. Revenue growth: +12% against the peers' median +9%. Operating margin: 30.8% against the peers' median 11.4%.
| Company | Quarter | Revenue | Y/Y | Op. margin |
|---|---|---|---|---|
| GRMN Garmin | Q3 2026 | $2.0B | +12% | 30.8% |
| NOC Northrop Grumman | Q3 2026 | $11.1B | +7% | 11.4% |
| LHX L3Harris Technologies | Q3 2026 | $6.1B | +7% | 13.0% |
| TDY Teledyne Technologies | Q3 2026 | $1.7B | +9% | 20.6% |
| DRS Leonardo DRS | Q3 2026 | $1.1B | +11% | 10.9% |
| LUNR Intuitive Machines | Q2 2026 | $206M | +310% | -22.9% |
| LYNX Lyntris | Q3 2026 | $194M | +90% | 5.7% |
| CODA Coda Octopus Group | Q3 FY26 | $7.7M | +9% | 19.9% |
| MIND Mind Technology | Q2 FY27 | $5.6M | -58% | -31.9% |
Source: Garmin 10-Q on SEC EDGAR · CIK 1121788 · Search, Detection, Navigation, Guidance, Aeronautical Sys
Guidance and outlook
More on GRMN
History
Every quarter: Q3 2026 results · Q2 2026 results · Q1 2026 results · Q4 2025 results · Q3 2025 results · Q2 2025 results · Q1 2025 results
- Garmin gross margin by quarter
- Garmin operating margin by quarter
- Garmin net income by quarter
- Garmin free cash flow by quarter
- Garmin R&D spending by quarter
- Garmin capital expenditures by quarter
- Garmin Fitness Segment revenue by quarter
- Garmin Outdoor Segment revenue by quarter
- Garmin Marine Segment revenue by quarter