Filing Flows › Industrials › Intuitive Machines (LUNR)
Intuitive Machines (LUNR) earnings and revenue breakdown
Latest: Q2 2026 · 10-Q filed Aug 13, 2026 · Intuitive Machines (LUNR) Q2 2026 earnings results →
Q2 2026 Revenue up 310% year over year to $206M · 30¢ of every $1 of revenue lost · operating margin -22.9%
Intuitive Machines made $206M in Q2 2026 (+310% Y/Y): Product revenue $167M, Service revenue $36.7M, Other revenues $2.8M. Operating margin -22.9%, net loss $62.8M. See where every dollar goes — costs, profit and cash — as a Sankey from the 10-Q filed Aug 13, 2026.
Drawing the Sankey…
Open the interactive Sankey → click any line for what the company wrote about it, compare Y/Y and Q/Q, export as PNG or PDF
What changed this quarter
Revenue was $206.2M in Q2 2026, up 310% year over year and up 10% from the previous quarter. Product revenue was the largest line at 81% of revenue. Service revenue declined 27%.
Operating costs exceeded revenue by $47.1M, an operating margin of -22.9%. Total costs grew 221% against revenue growth of 310%. The fastest-growing cost line was Research & development (+1577%). The quarter ended with a net loss of $62.8M, wider than the previous quarter's $52.5M loss. Minority interests bore $16.4M of it: to shareholders the quarter was a loss of $46.4M.
Operating cash flow was −$57.1M. Non-cash charges added back $14.9M of depreciation and amortization and $10.5M of share-based compensation. Working capital and other items used $19.7M. Capital expenditures of $24.1M exceeded it, leaving free cash flow of −$81.2M.
Quarterly history
| Quarter | Form | Filed | Revenue | Y/Y | Op. margin | Net earnings | Op. cash flow |
|---|---|---|---|---|---|---|---|
| Q2 2026 | 10-Q | Aug 13, 2026 | $206M | +310% | -22.9% | −$62.8M | −$57.1M |
| Q1 2026 | 10-Q | May 15, 2026 | $187M | +199% | -21.0% | −$52.5M | −$54.8M |
| Q4 2025 | 10-K | Mar 19, 2026 | $44.8M | -18% | -73.9% | −$59.7M | −$7.3M |
| Q3 2025 | 10-Q | Nov 13, 2025 | $52.4M | -10% | -29.4% | −$10.0M | −$7.2M |
| Q2 2025 | 10-Q | Aug 7, 2025 | $50.3M | +21% | -56.9% | −$38.2M | −$19.3M |
| Q1 2025 | 10-Q | May 13, 2025 | $62.5M | -15% | -16.1% | $975K | $19.4M |
| Q4 2024 | 10-K | Mar 25, 2025 | $54.7M | +79% | -24.5% | −$165M | −$2.0M |
Charts
In supply chains and themes
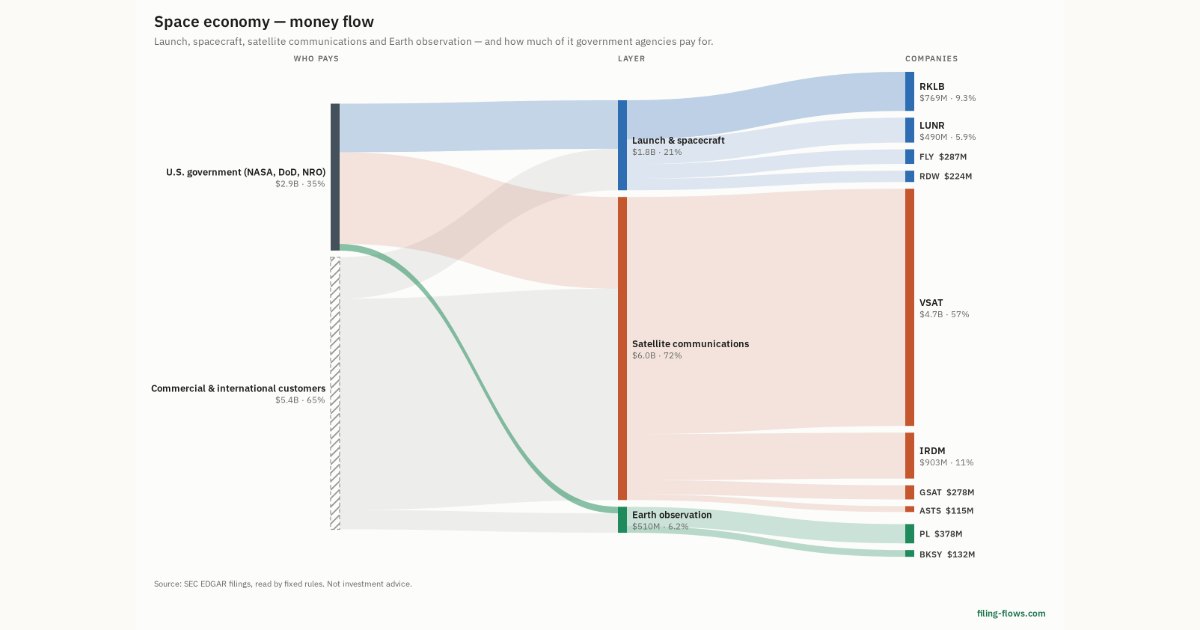
Interactive views
The same charts as the app — open one to draw it.
💵Where each $1 goesinteractive
Loading the interactive chart…
🌏Named in Asian annual reportsinteractive
Loading the interactive chart…
🔄Rotation against the market and its industry (RRG)interactive
Loading the interactive chart…
🔍Earnings qualityinteractive
Loading the interactive chart…
⚖️Fair value by methodinteractive
Loading the interactive chart…
🔭Outlook & guidanceinteractive
Loading the interactive chart…
📈Investments: gains and what it boughtinteractive
Loading the interactive chart…
🏭Its industry’s money flow (input-output)interactive
Loading the interactive chart…
About Intuitive Machines
Intuitive Machines, Inc., collectively with its subsidiaries (the “Company,” “IM,” “Intuitive Machines,” “we,” “us” or “our”) is a space infrastructure and services company founded in 2013 and focused on enabling sustained infrastructure and human activity beyond Earth. We believe the United States is transitioning from episodic space missions to long-duration operations and persistent presence, and we are building the systems and services required to support this evolution across civil, national security, and commercial markets. We build spacecraft, connect space-based networks, and operate infrastructure as-a-service that support operations across low Earth orbit (“LEO”), geostationary orbit (“GEO”), cislunar space, and deep-space.
In its own words, from its 10-K, filed Mar 19, 2026.
Intuitive Machines against its Search, Detection, Navigation, Guidance, Aeronautical Sys peers
The largest companies of the same SEC industry, each at its latest quarter. Revenue growth: +310% against the peers' median +9%. Operating margin: -22.9% against the peers' median 11.4%.
| Company | Quarter | Revenue | Y/Y | Op. margin |
|---|---|---|---|---|
| LUNR Intuitive Machines | Q2 2026 | $206M | +310% | -22.9% |
| NOC Northrop Grumman | Q3 2026 | $11.1B | +7% | 11.4% |
| LHX L3Harris Technologies | Q3 2026 | $6.1B | +7% | 13.0% |
| GRMN Garmin | Q3 2026 | $2.0B | +12% | 30.8% |
| TDY Teledyne Technologies | Q3 2026 | $1.7B | +9% | 20.6% |
| DRS Leonardo DRS | Q3 2026 | $1.1B | +11% | 10.9% |
| LYNX Lyntris | Q3 2026 | $194M | +90% | 5.7% |
| CODA Coda Octopus Group | Q3 FY26 | $7.7M | +9% | 19.9% |
| MIND Mind Technology | Q2 FY27 | $5.6M | -58% | -31.9% |
Source: Intuitive Machines 10-Q on SEC EDGAR · CIK 1844452 · Search, Detection, Navigation, Guidance, Aeronautical Sys
13F: who owns LUNR and who is buying
More on LUNR
History
Every quarter: Q2 2026 results · Q1 2026 results · Q4 2025 results · Q3 2025 results · Q2 2025 results · Q1 2025 results · Q4 2024 results