Filing Flows › Consumer Discretionary › Hilton Grand Vacations (HGV)
Hilton Grand Vacations (HGV) earnings and revenue breakdown
Latest: Q3 2026 · 10-Q filed Oct 29, 2026 · Hilton Grand Vacations (HGV) Q3 2026 earnings results →
Q3 2026 Revenue up 51% year over year to $2.0B · 15¢ of every $1 of revenue kept as net profit · operating margin 25.1%
Hilton Grand Vacations made $2.0B in Q3 2026 (+51% Y/Y): Sales of VOIs, net $1.1B, Resort and club management $196M, Rental and ancillary services $194M. Operating margin 25.1%, net earnings $291M. See where every dollar goes — costs, profit and cash — as a Sankey from the 10-Q filed Oct 29, 2026.
Drawing the Sankey…
Open the interactive Sankey → click any line for what the company wrote about it, compare Y/Y and Q/Q, export as PNG or PDF
What changed this quarter
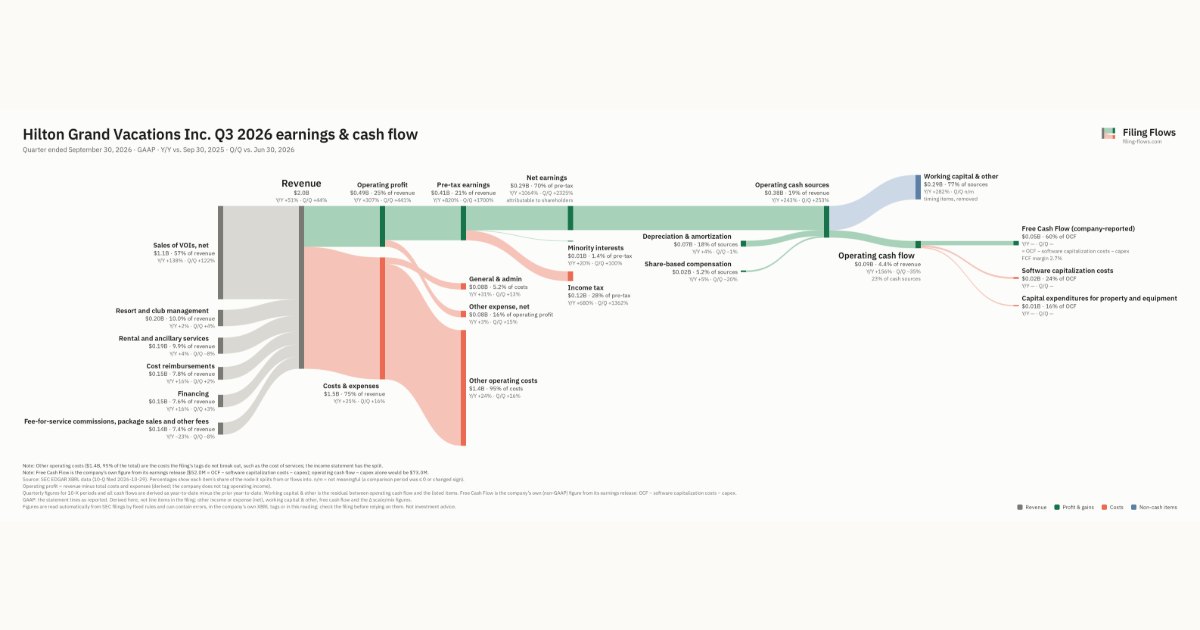
Revenue was $2.0B in Q3 2026, up 51% year over year and up 44% from the previous quarter. Sales of VOIs, net was the largest line at 57% of revenue. Sales of VOIs, net added $0.65B year over year (up 138%), 98% of the total change. Fee-for-service commissions, package sales and other fees declined 23%.
Operating profit was $0.49B, a 25.1% margin (up 15.8 points year over year). Of the extra revenue versus Q3 2025, 56% reached operating profit, above the 9% margin then. Total costs grew 25% against revenue growth of 51%. The fastest-growing cost line was General & admin (+31%). Net earnings were $0.29B, up 1064% year over year. The effective tax rate was 28.3%.
Operating cash flow was $0.09B (up 156% year over year), 29% of net income including minority interests. Non-cash charges added back $0.07B of depreciation and amortization and $0.02B of share-based compensation. Working capital and other items used $0.30B. After software capitalization costs ($0.02B) and capital expenditures for property and equipment ($0.01B), free cash flow as the company reports it was $0.05B.
Quarterly history
| Quarter | Form | Filed | Revenue | Y/Y | Op. margin | Net earnings | Op. cash flow |
|---|---|---|---|---|---|---|---|
| Q3 2026 | 10-Q | Oct 29, 2026 | $2.0B | +51% | 25.1% | $291M | $87.0M |
| Q2 2026 | 10-Q | Jul 30, 2026 | $1.4B | +7% | 6.7% | $12.0M | $134M |
| Q1 2026 | 10-Q | Apr 30, 2026 | $1.3B | +12% | 11.1% | $66.0M | $128M |
| Q4 2025 | 10-K | Feb 26, 2026 | $1.3B | +4% | 12.5% | $48.0M | $167M |
| Q3 2025 | 10-Q | Oct 30, 2025 | $1.3B | -0.5% | 9.3% | $25.0M | $34.0M |
| Q2 2025 | 10-Q | Jul 31, 2025 | $1.3B | +2% | 8.8% | $25.0M | $61.0M |
| Q1 2025 | 10-Q | May 1, 2025 | $1.1B | -0.7% | 5.2% | −$12.0M | $38.0M |
Charts
Interactive views
The same charts as the app — open one to draw it.
💵Where each $1 goesinteractive
Loading the interactive chart…
🌏Named in Asian annual reportsinteractive
Loading the interactive chart…
🔄Rotation against the market and its industry (RRG)interactive
Loading the interactive chart…
🔍Earnings qualityinteractive
Loading the interactive chart…
⚖️Fair value by methodinteractive
Loading the interactive chart…
🔭Outlook & guidanceinteractive
Loading the interactive chart…
📈Investments: gains and what it boughtinteractive
Loading the interactive chart…
🏭Its industry’s money flow (input-output)interactive
Loading the interactive chart…
About Hilton Grand Vacations
On January 3, 2017, HGV became an independent publicly traded company as a result of Hilton Worldwide Holdings Inc.'s (“Hilton”) tax-free spin-off of each of HGV and Park Hotels & Resorts Inc. (“Park”). HGV's common stock is listed on the New York Stock Exchange under the symbol “HGV.” Following the spin-off, Hilton did not retain any ownership in HGV. In connection with the spin-off, we entered into agreements with Hilton and other third parties, including licenses to use the Hilton Grand Vacations brand. For more information regarding these agreements, see “— Business—Agreements with Hilton Worldwide Holdings. ”
In its own words, from its 10-K, filed Feb 26, 2026.
Hilton Grand Vacations against its Hotels, Rooming Houses, Camps & Other Lodging Places peers
The largest companies of the same SEC industry, each at its latest quarter. Revenue growth: +51% against the peers' median +13%. Operating margin: 25.1% against the peers' median 6.9%.
| Company | Quarter | Revenue | Y/Y | Op. margin |
|---|---|---|---|---|
| HGV Hilton Grand Vacations | Q3 2026 | $2.0B | +51% | 25.1% |
| CVEO Civeo | Q3 2026 | $193M | +13% | 6.9% |
| TH Target Hospitality | Q2 2026 | $85.5M | +39% | -8.8% |
| Pismo Coast Village | Q3 FY26 | $3.1M | +6% | 24.0% |
| MDLK ModuLink | Q2 2026 | $360K | +6% | -24.9% |
Source: Hilton Grand Vacations 10-Q on SEC EDGAR · CIK 1674168 · Hotels, Rooming Houses, Camps & Other Lodging Places
13F: who owns HGV and who is buying
More on HGV
- How Hilton Grand Vacations makes money: revenue by segment
- Hilton Grand Vacations next earnings date and what analysts expect
- Hilton Grand Vacations stock forecast, price target and fair value
- Who owns Hilton Grand Vacations stock: holders, funds and Congress trades
- Hilton Grand Vacations guidance and outlook
History
Every quarter: Q3 2026 results · Q2 2026 results · Q1 2026 results · Q4 2025 results · Q3 2025 results · Q2 2025 results · Q1 2025 results
- Hilton Grand Vacations guidance history: guided vs reported
- Hilton Grand Vacations operating margin by quarter
- Hilton Grand Vacations net income by quarter
- Hilton Grand Vacations free cash flow by quarter
- Hilton Grand Vacations Sales of VOIs, net revenue by quarter
- Hilton Grand Vacations Resort and club management revenue by quarter
- Hilton Grand Vacations Rental and ancillary services revenue by quarter