Filing Flows › Financials › Robinhood Markets (HOOD)
Robinhood Markets (HOOD) earnings and revenue breakdown
Latest: Q3 2026 · 10-Q filed Oct 28, 2026 · Robinhood Markets (HOOD) Q3 2026 earnings results →
Q3 2026 Revenue up 12% year over year to $1.4B · 33¢ of every $1 of revenue kept as net profit · operating margin 43.3%
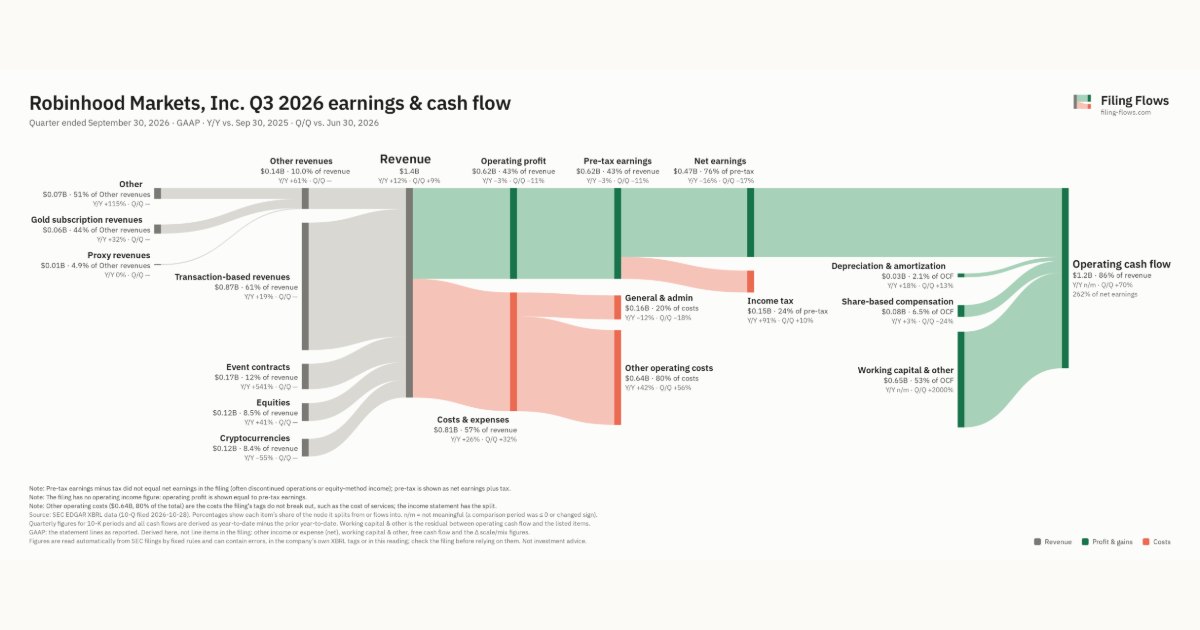
Robinhood Markets made $1.4B in Q3 2026 (+12% Y/Y): Transaction-based revenues $867M, Event contracts $173M, Other revenues $142M. Operating margin 43.3%, net earnings $468M. See where every dollar goes — costs, profit and cash — as a Sankey from the 10-Q filed Oct 28, 2026.
Drawing the Sankey…
Open the interactive Sankey → click any line for what the company wrote about it, compare Y/Y and Q/Q, export as PNG or PDF
What changed this quarter
Revenue was $1.4B in Q3 2026, up 12% year over year and up 9% from the previous quarter. Transaction-based revenues was the largest line at 61% of revenue. Event contracts added $0.15B year over year (up 541%), 97% of the total change. Cryptocurrencies declined 55%.
Operating profit was $0.62B, a 43.3% margin (down 6.4 points year over year). Operating profit fell $0.02B even though revenue rose $0.15B versus Q3 2025, so costs grew faster than sales. Total costs grew 26% against revenue growth of 12%. The fastest-growing cost line was Other operating costs (+42%). Net earnings were $0.47B, down 16% year over year. The effective tax rate was 24.1%.
Operating cash flow was $1.2B, 262% of net earnings. Non-cash charges added back $0.03B of depreciation and amortization and $0.08B of share-based compensation. Working capital and other items added $0.65B.
Quarterly history
| Quarter | Form | Filed | Revenue | Y/Y | Op. margin | Net earnings | Op. cash flow |
|---|---|---|---|---|---|---|---|
| Q3 2026 | 10-Q | Oct 28, 2026 | $1.4B | +12% | 43.3% | $468M | $1.2B |
| Q2 2026 | 10-Q | Jul 30, 2026 | $1.3B | +32% | 53.3% | $561M | $720M |
| Q1 2026 | 10-Q | Apr 29, 2026 | $1.1B | +15% | 38.9% | $350M | $2.0B |
| Q4 2025 | 10-K | Feb 18, 2026 | $1.3B | +26% | 51.5% | $605M | −$937M |
| Q3 2025 | 10-Q | Nov 6, 2025 | $1.3B | +100% | 49.8% | $556M | −$1.6B |
| Q2 2025 | 10-Q | Jul 31, 2025 | $989M | +45% | 44.7% | $386M | $3.5B |
| Q1 2025 | 10-Q | May 1, 2025 | $927M | +50% | 40.0% | $336M | $642M |
Charts
In supply chains and themes
Interactive views
The same charts as the app — open one to draw it.
💵Where each $1 goesinteractive
Loading the interactive chart…
🌏Named in Asian annual reportsinteractive
Loading the interactive chart…
🔄Rotation against the market and its industry (RRG)interactive
Loading the interactive chart…
🔍Earnings qualityinteractive
Loading the interactive chart…
⚖️Fair value by methodinteractive
Loading the interactive chart…
🔭Outlook & guidanceinteractive
Loading the interactive chart…
📈Investments: gains and what it boughtinteractive
Loading the interactive chart…
🏭Its industry’s money flow (input-output)interactive
Loading the interactive chart…
Customers and suppliers named in filings
Sells to
- Citadel Securities, LLC — 13% of its revenue · Stated in 10-K (XBRL) · source
- Wintermute Trading Ltd — 6% of its revenue · Stated in 10-K (XBRL) · source
About Robinhood Markets
Robinhood was founded in 2013 on the belief that everyone should be welcome to participate in our financial system. We are creating modern financial services platforms for everyone, regardless of their wealth, income, or background. Our mission is to democratize finance for all. We use technology to provide access to the financial system in a way that is simple and convenient for our customers. We believe the financial system should be built to work for everyone. That’s why we create products that let our customers start investing at their own pace, on their own terms. We believe investing should be familiar and welcoming, with a simple design and an intuitive interface, so that customers are empowered to achieve their goals. We started with a revolutionary, bold brand and design in the Robinhood app which makes investing approachable for millions.
In its own words, from its 10-K, filed Feb 18, 2026.
Robinhood Markets against its Security Brokers, Dealers & Flotation Companies peers
The largest companies of the same SEC industry, each at its latest quarter. Revenue growth: +12% against the peers' median +13%. Operating margin: 43.3% against the peers' median 30.0%.
| Company | Quarter | Revenue | Y/Y | Op. margin |
|---|---|---|---|---|
| HOOD Robinhood Markets | Q3 2026 | $1.4B | +12% | 43.3% |
| MS Morgan Stanley | Q3 2026 | $20.3B | +12% | 31.9% |
| GS Goldman Sachs Group | Q3 2026 | $18.7B | +23% | 37.5% |
| GLXY Galaxy Digital | Q3 2026 | $8.1B | -72% | 4.3% |
| BLK BlackRock | Q3 2026 | $7.8B | +19% | 30.0% |
| SCHW Schwab Charles | Q3 2026 | $7.2B | +17% | 52.7% |
| Jones Financial Companies Lllp | Q3 2026 | $5.2B | +13% | 0.0% |
| RJF Raymond James Financial | Q4 FY26 | $4.7B | +13% | 18.2% |
| JEF Jefferies Financial Group | Q3 FY26 | $3.2B | +11% | 10.9% |
Source: Robinhood Markets 10-Q on SEC EDGAR · CIK 1783879 · Security Brokers, Dealers & Flotation Companies
13F: who owns HOOD and who is buying
More on HOOD
History
Every quarter: Q3 2026 results · Q2 2026 results · Q1 2026 results · Q4 2025 results · Q3 2025 results · Q2 2025 results · Q1 2025 results