Filing Flows › Materials › International Flavors & Fragrances (IFF)
International Flavors & Fragrances (IFF) earnings and revenue breakdown
Latest: Q3 2026 · 10-Q filed Nov 3, 2026 · International Flavors & Fragrances (IFF) Q3 2026 earnings results →
Q3 2026 Revenue up 4% year over year to $1.9B · 3¢ of every $1 of revenue lost · operating margin 8.2%
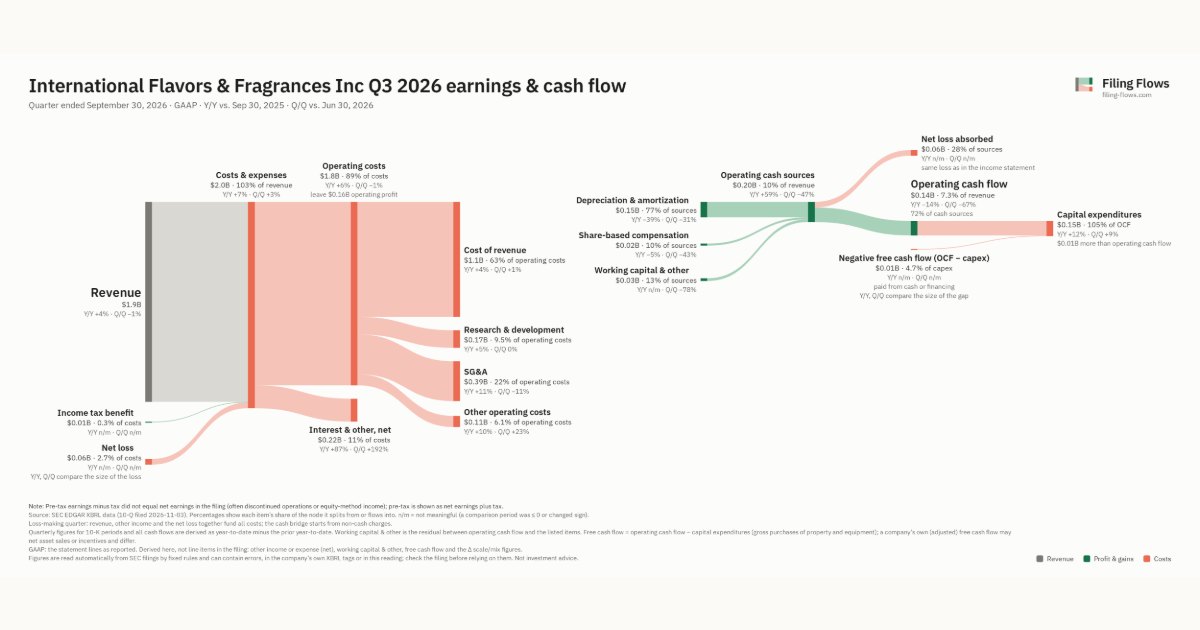
International Flavors & Fragrances made $1.9B in Q3 2026 (+4% Y/Y). Operating margin 8.2%, net loss $55.0M. See where every dollar goes — costs, profit and cash — as a Sankey from the 10-Q filed Nov 3, 2026.
Drawing the Sankey…
Open the interactive Sankey → click any line for what the company wrote about it, compare Y/Y and Q/Q, export as PNG or PDF
What changed this quarter
Revenue was $1.9B in Q3 2026, up 4% year over year and down 1% from the previous quarter.
Gross margin was 42.5%, down 0.3 points from Q3 2025. Operating profit was $0.16B, a 8.2% margin (down 2.0 points year over year). Operating profit fell $0.03B even though revenue rose $0.07B versus Q3 2025, so costs grew faster than sales. Operating expenses grew 9% against revenue growth of 4%. The fastest-growing cost line was SG&A (+11%). The quarter ended with a net loss of $0.06B, after a profit of $0.05B the previous quarter. Net interest and other expense of $0.22B was the main reason.
Operating cash flow was $0.14B (down 14% year over year). Non-cash charges added back $0.15B of depreciation and amortization and $0.02B of share-based compensation. Working capital and other items added $0.03B. Capital expenditures of $0.15B exceeded it, leaving free cash flow of −$0.01B.
Quarterly history
| Quarter | Form | Filed | Revenue | Y/Y | Op. margin | Net earnings | Op. cash flow |
|---|---|---|---|---|---|---|---|
| Q3 2026 | 10-Q | Nov 3, 2026 | $1.9B | +4% | 8.2% | −$55.0M | $141M |
| Q2 2026 | 10-Q | Aug 4, 2026 | $2.0B | +2% | 8.1% | $51.0M | $422M |
| Q1 2026 | 10-Q | May 5, 2026 | $2.7B | -4% | 10.0% | $170M | $257M |
| Q4 2025 | 10-K | Feb 27, 2026 | $2.6B | -7% | 3.7% | $18.0M | $318M |
| Q3 2025 | 10-Q | Nov 4, 2025 | $2.7B | -8% | 8.4% | $41.0M | $164M |
| Q2 2025 | 10-Q | Aug 5, 2025 | $2.8B | -4% | 7.2% | $599M | $241M |
| Q1 2025 | 10-Q | May 6, 2025 | $2.8B | -2% | -31.8% | −$1.0B | $127M |
Charts
Interactive views
The same charts as the app — open one to draw it.
💵Where each $1 goesinteractive
Loading the interactive chart…
🌏Named in Asian annual reportsinteractive
Loading the interactive chart…
🔄Rotation against the market and its industry (RRG)interactive
Loading the interactive chart…
🔍Earnings qualityinteractive
Loading the interactive chart…
⚖️Fair value by methodinteractive
Loading the interactive chart…
🔭Outlook & guidanceinteractive
Loading the interactive chart…
📈Investments: gains and what it boughtinteractive
Loading the interactive chart…
🏭Its industry’s money flow (input-output)interactive
Loading the interactive chart…
About International Flavors & Fragrances
We are a leading creator and manufacturer of products for application in food, beverage, health & biosciences, and scent, as well as complementary adjacent products, including natural health ingredients, all of which are used in a wide variety of consumer and end-use products. Our products are sold principally to manufacturers of dairy, meat, beverages, snacks, savory, sweet, baked goods, grain processors and other foods, personal care products, soaps and detergents, cleaning products, perfumes, dietary supplements, food protection, infant, elderly and animal nutrition, functional food, bio-fuel, and oral care products. As a result, we hold global leadership positions in the Food & Beverage, Home & Personal Care and Health & Wellness markets, and across key Tastes, Textures, Scents, Nutrition, Enzymes, Cultures, Soy Proteins and Probiotics categories, among others.
In its own words, from its 10-K, filed Feb 27, 2026.
International Flavors & Fragrances against its Industrial Organic Chemicals peers
The largest companies of the same SEC industry, each at its latest quarter. Revenue growth: +4% against the peers' median +5%. Operating margin: 8.2% against the peers' median 15.9%.
| Company | Quarter | Revenue | Y/Y | Op. margin |
|---|---|---|---|---|
| IFF International Flavors & Fragrances | Q3 2026 | $1.9B | +4% | 8.2% |
| LYB LyondellBasell Industries N.V. | Q3 2026 | $8.5B | +10% | 12.6% |
| WLK Westlake | Q3 2026 | $3.0B | +5% | 1.4% |
| Union Carbide | Q3 2026 | $1.5B | +38% | 29.6% |
| NEU Newmarket | Q3 2026 | $717M | +4% | 20.0% |
| GPRE Green Plains | Q3 2026 | $496M | -2% | 18.7% |
| SXT Sensient Technologies | Q3 2026 | $456M | +11% | 15.9% |
| WLKP Westlake Chemical Partners LP | Q3 2026 | $314M | +2% | 30.4% |
| ALTO Alto Ingredients | Q3 2026 | $258M | +7% | 2.7% |
Source: International Flavors & Fragrances 10-Q on SEC EDGAR · CIK 51253 · Industrial Organic Chemicals
Guidance and outlook
13F: who owns IFF and who is buying
More on IFF
- How International Flavors & Fragrances makes money: revenue by segment
- International Flavors & Fragrances next earnings date and what analysts expect
- International Flavors & Fragrances stock forecast, price target and fair value
- Who owns International Flavors & Fragrances stock: holders, funds and Congress trades
- International Flavors & Fragrances guidance and outlook
- Is International Flavors & Fragrances a takeover target? LBO and rumors
- International Flavors & Fragrances recalls, complaints and regulation
History
Every quarter: Q3 2026 results · Q2 2026 results · Q1 2026 results · Q4 2025 results · Q3 2025 results · Q2 2025 results · Q1 2025 results
- International Flavors & Fragrances guidance history: guided vs reported
- International Flavors & Fragrances gross margin by quarter
- International Flavors & Fragrances operating margin by quarter
- International Flavors & Fragrances net income by quarter
- International Flavors & Fragrances free cash flow by quarter
- International Flavors & Fragrances R&D spending by quarter
- International Flavors & Fragrances capital expenditures by quarter