Filing Flows › Materials › Westlake (WLK)
Westlake (WLK) earnings and revenue breakdown
Latest: Q3 2026 · 10-Q filed Nov 4, 2026 · Westlake (WLK) Q3 2026 earnings results →
Q3 2026 Revenue up 5% year over year to $3.0B · 1¢ of every $1 of revenue kept as net profit · operating margin 1.4%
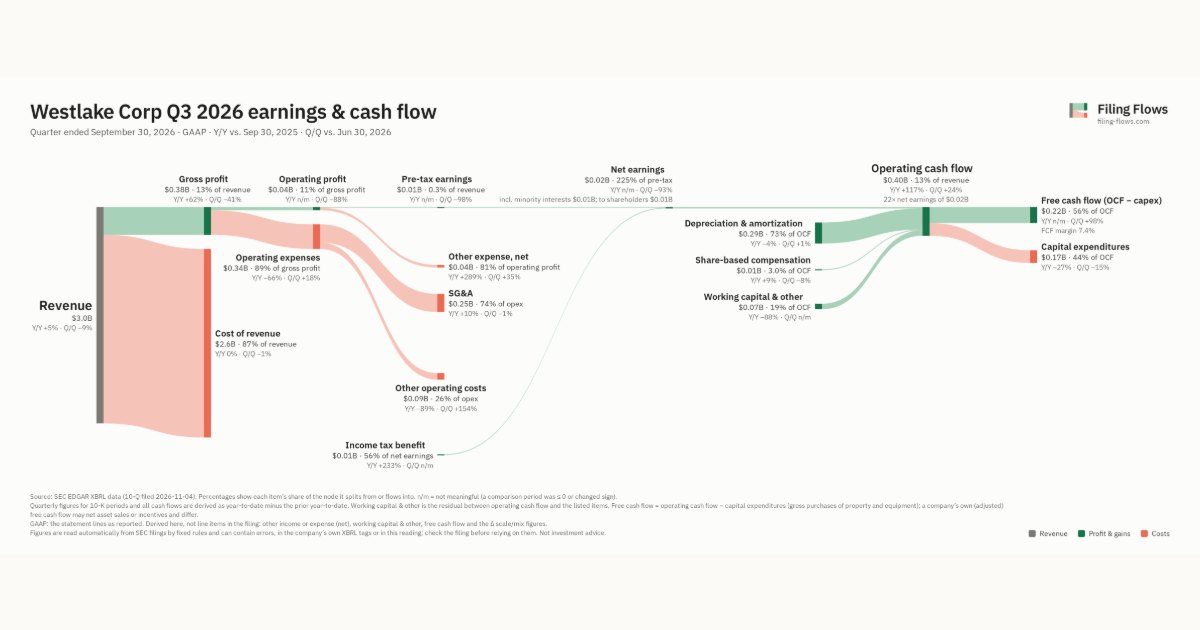
Westlake made $3.0B in Q3 2026 (+5% Y/Y). Operating margin 1.4%, net earnings $18.0M. See where every dollar goes — costs, profit and cash — as a Sankey from the 10-Q filed Nov 4, 2026.
Drawing the Sankey…
Open the interactive Sankey → click any line for what the company wrote about it, compare Y/Y and Q/Q, export as PNG or PDF
What changed this quarter
Revenue was $3.0B in Q3 2026, up 5% year over year and down 9% from the previous quarter.
Gross margin was 12.8%, up 4.5 points from Q3 2025. Operating profit was $0.04B, a 1.4% margin (up 28.4 points year over year). Operating expenses fell 66% while revenue rose 5%. Net earnings were $0.01B. The tax line was a benefit of $0.01B on pre-tax earnings of $0.01B.
Operating cash flow was $0.40B (up 117% year over year), 2194% of net income including minority interests. Non-cash charges added back $0.29B of depreciation and amortization and $0.01B of share-based compensation. Working capital and other items added $0.07B. Capital expenditures of $0.17B left free cash flow of $0.22B.
Quarterly history
| Quarter | Form | Filed | Revenue | Y/Y | Op. margin | Net earnings | Op. cash flow |
|---|---|---|---|---|---|---|---|
| Q3 2026 | 10-Q | Nov 4, 2026 | $3.0B | +5% | 1.4% | $18.0M | $395M |
| Q2 2026 | 10-Q | Aug 5, 2026 | $3.3B | +11% | 11.1% | $260M | $318M |
| Q1 2026 | 10-Q | May 6, 2026 | $2.7B | -7% | -6.5% | −$157M | −$94.0M |
| Q4 2025 | 10-K | Feb 26, 2026 | $2.5B | -11% | -26.5% | −$533M | $225M |
| Q3 2025 | 10-Q | Oct 31, 2025 | $2.8B | -9% | -27.0% | −$772M | $182M |
| Q2 2025 | 10-Q | Aug 6, 2025 | $3.0B | -8% | -3.7% | −$131M | $135M |
| Q1 2025 | 10-Q | May 2, 2025 | $2.8B | -4% | -1.1% | −$35.0M | −$77.0M |
Charts
Interactive views
The same charts as the app — open one to draw it.
💵Where each $1 goesinteractive
Loading the interactive chart…
🌏Named in Asian annual reportsinteractive
Loading the interactive chart…
🔄Rotation against the market and its industry (RRG)interactive
Loading the interactive chart…
🔍Earnings qualityinteractive
Loading the interactive chart…
⚖️Fair value by methodinteractive
Loading the interactive chart…
🔭Outlook & guidanceinteractive
Loading the interactive chart…
📈Investments: gains and what it boughtinteractive
Loading the interactive chart…
🏭Its industry’s money flow (input-output)interactive
Loading the interactive chart…
Customers and suppliers named in filings
Sells to
About Westlake
Westlake Corporation is a vertically integrated global manufacturer and marketer of both housing and infrastructure products and performance and essential materials that are designed to enhance the lives of people every day. Our products include some of the most widely used materials in the world, which are fundamental to many diverse consumer and industrial markets, including residential construction, flexible and rigid packaging, automotive, healthcare, water treatment, wind turbines, coatings as well as other durable and non-durable goods. We operate in two principal operating segments, Housing and Infrastructure Products (HIP) and Performance and Essential Materials (PEM). We are highly integrated along our materials chain with significant downstream integration from ethylene and chlor-alkali (chlorine and caustic soda) into vinyls, polyethylene (PE) and epoxy.
In its own words, from its 10-K, filed Feb 26, 2026.
Westlake against its Industrial Organic Chemicals peers
The largest companies of the same SEC industry, each at its latest quarter. Revenue growth: +5% against the peers' median +5%. Operating margin: 1.4% against the peers' median 15.9%.
| Company | Quarter | Revenue | Y/Y | Op. margin |
|---|---|---|---|---|
| WLK Westlake | Q3 2026 | $3.0B | +5% | 1.4% |
| LYB LyondellBasell Industries N.V. | Q3 2026 | $8.5B | +10% | 12.6% |
| IFF International Flavors & Fragrances | Q3 2026 | $1.9B | +4% | 8.2% |
| Union Carbide | Q3 2026 | $1.5B | +38% | 29.6% |
| NEU Newmarket | Q3 2026 | $717M | +4% | 20.0% |
| GPRE Green Plains | Q3 2026 | $496M | -2% | 18.7% |
| SXT Sensient Technologies | Q3 2026 | $456M | +11% | 15.9% |
| WLKP Westlake Chemical Partners LP | Q3 2026 | $314M | +2% | 30.4% |
| ALTO Alto Ingredients | Q3 2026 | $258M | +7% | 2.7% |
Source: Westlake 10-Q on SEC EDGAR · CIK 1262823 · Industrial Organic Chemicals
Guidance and outlook
13F: who owns WLK and who is buying
More on WLK
History
Every quarter: Q3 2026 results · Q2 2026 results · Q1 2026 results · Q4 2025 results · Q3 2025 results · Q2 2025 results · Q1 2025 results