Filing Flows › Industrials › Incyte (INCY)
Incyte (INCY) earnings and revenue breakdown
Latest: Q3 2026 · 10-Q filed Oct 29, 2026 · Incyte (INCY) Q3 2026 earnings results →
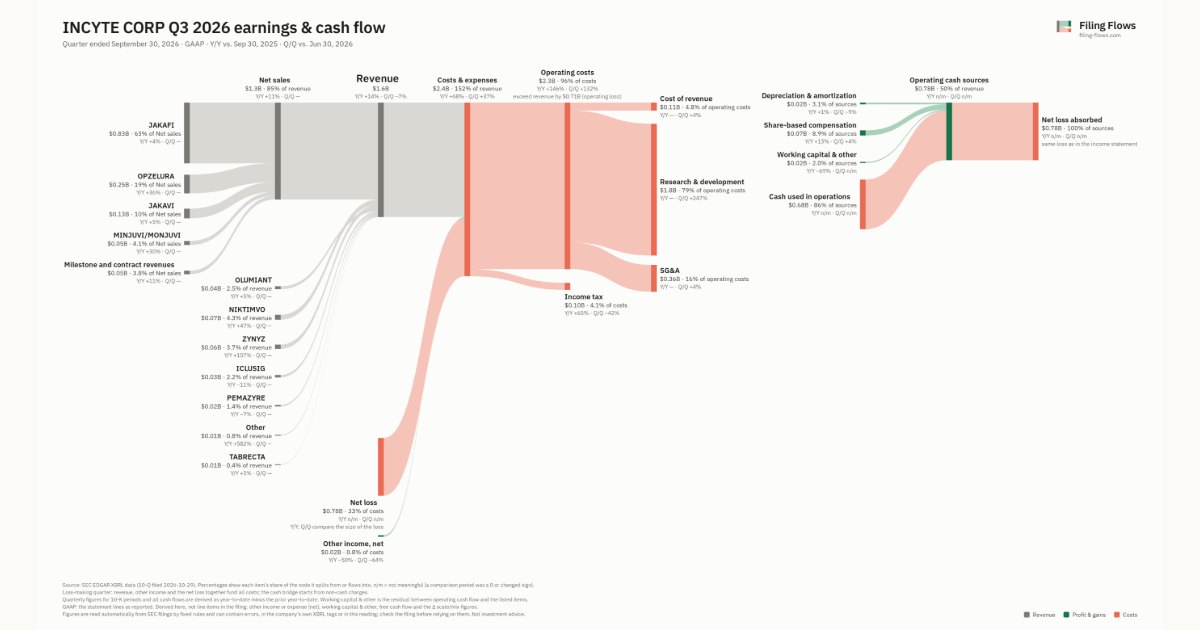
Q3 2026 Revenue up 14% year over year to $1.6B · 50¢ of every $1 of revenue lost · operating margin -45.5%
Incyte made $1.6B in Q3 2026 (+14% Y/Y): Net sales $1.3B, NIKTIMVO $67.4M, ZYNYZ $58.3M. Operating margin -45.5%, net loss $785M. See where every dollar goes — costs, profit and cash — as a Sankey from the 10-Q filed Oct 29, 2026.
Drawing the Sankey…
Open the interactive Sankey → click any line for what the company wrote about it, compare Y/Y and Q/Q, export as PNG or PDF
What changed this quarter
Revenue was $1.6B in Q3 2026, up 14% year over year and down 7% from the previous quarter. JAKAFI was the largest line at 53% of revenue. OPZELURA added $0.07B year over year (up 36%), 35% of the total change. ICLUSIG declined 11%.
Operating costs exceeded revenue by $0.71B, an operating margin of -45.5%. Total costs grew 146% against revenue growth of 14%. The quarter ended with a net loss of $0.78B, after a profit of $0.59B the previous quarter.
Operating cash flow was −$0.68B. Non-cash charges added back $0.02B of depreciation and amortization and $0.07B of share-based compensation.
Quarterly history
| Quarter | Form | Filed | Revenue | Y/Y | Op. margin | Net earnings | Op. cash flow |
|---|---|---|---|---|---|---|---|
| Q3 2026 | 10-Q | Oct 29, 2026 | $1.6B | +14% | -45.5% | −$785M | −$675M |
| Q2 2026 | 10-Q | Jul 28, 2026 | $1.7B | +38% | 41.7% | $586M | $508M |
| Q1 2026 | 10-Q | Apr 28, 2026 | $1.3B | +21% | 23.7% | $303M | $369M |
| Q4 2025 | 10-K | Feb 10, 2026 | $1.5B | +28% | 22.3% | $299M | $543M |
| Q3 2025 | 10-Q | Oct 28, 2025 | $1.4B | +20% | 32.5% | $424M | $559M |
| Q2 2025 | 10-Q | Jul 29, 2025 | $1.2B | +16% | 43.6% | $405M | $44.7M |
| Q1 2025 | 10-Q | Apr 29, 2025 | $1.1B | +20% | 19.5% | $158M | $266M |
Charts
Interactive views
The same charts as the app — open one to draw it.
💵Where each $1 goesinteractive
Loading the interactive chart…
🌏Named in Asian annual reportsinteractive
Loading the interactive chart…
🔄Rotation against the market and its industry (RRG)interactive
Loading the interactive chart…
🔍Earnings qualityinteractive
Loading the interactive chart…
⚖️Fair value by methodinteractive
Loading the interactive chart…
🔭Outlook & guidanceinteractive
Loading the interactive chart…
📈Investments: gains and what it boughtinteractive
Loading the interactive chart…
🏭Its industry’s money flow (input-output)interactive
Loading the interactive chart…
Customers and suppliers named in filings
Buys from
About Incyte
Incyte is a global biopharmaceutical company engaged in the discovery, development and commercialization of proprietary therapeutics. Our global headquarters is located in Wilmington, Delaware, where we conduct discovery, clinical development and commercial operations. We also conduct clinical development and commercial operations from our European headquarters in Morges, Switzerland, and our other offices across Europe, as well as our Japanese headquarters in Tokyo and our Canadian headquarters in Montreal. We are focused in three therapeutic areas that are defined by the indications of our approved medicines and the diseases for which our clinical candidates are being developed. These therapeutic areas are: Hematology, Oncology, and Inflammation and Autoimmunity (“IAI”).
In its own words, from its 10-K, filed Feb 10, 2026.
Incyte against its Services-Commercial Physical & Biological Research peers
The largest companies of the same SEC industry, each at its latest quarter. Revenue growth: +14% against the peers' median +8%. Operating margin: -45.5% against the peers' median 12.9%.
| Company | Quarter | Revenue | Y/Y | Op. margin |
|---|---|---|---|---|
| INCY Incyte | Q3 2026 | $1.6B | +14% | -45.5% |
| IQV IQVIA Holdings | Q3 2026 | $4.4B | +8% | 12.9% |
| CRL Charles River Laboratories International | Q3 2026 | $983M | -2% | 20.6% |
| MEDP Medpace Holdings | Q3 2026 | $716M | +8% | 23.1% |
| NRC NRC Health | Q3 2026 | $38.4M | +11% | 23.2% |
| MXCT Maxcyte | Q2 2026 | $7.3M | -14% | -140.7% |
| FOXO Foxo Technologies | Q2 2026 | $4.7M | -10% | 185.5% |
| OABI OmniAb | Q3 2026 | $4.0M | +78% | -409.9% |
| BIAF bioAffinity Technologies | Q3 2026 | $1.1M | -26% | -328.0% |
Source: Incyte 10-Q on SEC EDGAR · CIK 879169 · Services-Commercial Physical & Biological Research
Guidance and outlook
13F: who owns INCY and who is buying
More on INCY
- How Incyte makes money: revenue by segment
- Incyte next earnings date and what analysts expect
- Incyte stock forecast, price target and fair value
- Who owns Incyte stock: holders, funds and Congress trades
- Incyte guidance and outlook
- Is Incyte a takeover target? LBO and rumors
- Incyte recalls, complaints and regulation
History
Every quarter: Q3 2026 results · Q2 2026 results · Q1 2026 results · Q4 2025 results · Q3 2025 results · Q2 2025 results · Q1 2025 results
- Incyte guidance history: guided vs reported
- Incyte operating margin by quarter
- Incyte net income by quarter
- Incyte free cash flow by quarter
- Incyte R&D spending by quarter
- Incyte capital expenditures by quarter
- Incyte Net sales revenue by quarter
- Incyte NIKTIMVO revenue by quarter
- Incyte ZYNYZ revenue by quarter