Filing Flows › Industrials › Johnson Controls International (JCI)
Johnson Controls International (JCI) earnings and revenue breakdown
Latest: Q4 FY26 · 8-K filed Oct 27, 2026
Q4 FY26 Revenue up 10% year over year to $7.1B · 14¢ of every $1 of revenue kept as net profit · operating margin 14.9%
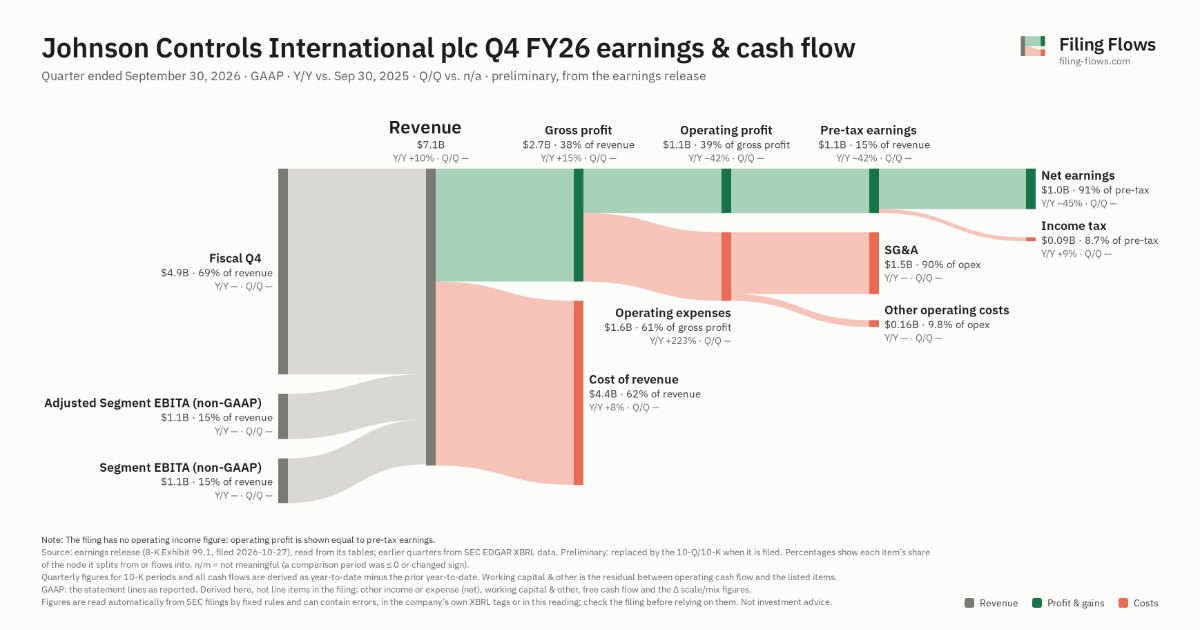
Johnson Controls International made $7.1B in Q4 FY26 (+10% Y/Y): Products and systems $5.0B, Services $2.1B. Operating margin 14.9%, net earnings $967M. See where every dollar goes — costs, profit and cash — as a Sankey from the 8-K filed Oct 27, 2026 (preliminary, from the earnings release).
Drawing the Sankey…
Open the interactive Sankey → click any line for what the company wrote about it, compare Y/Y and Q/Q, export as PNG or PDF
What changed this quarter
Revenue was $7.1B in Q4 FY26, up 10% year over year. Products and systems was the largest line at 70% of revenue. Products and systems added $0.56B year over year (up 13%), 84% of the total change.
Gross margin was 38.0%, up 1.5 points from Q4 FY25. Operating profit was $1.1B, a 14.9% margin (down 13.7 points year over year). Operating profit fell $0.78B even though revenue rose $0.67B versus Q4 FY25, so costs grew faster than sales. Operating expenses grew 223% against revenue growth of 10%. Net earnings were $1.0B, down 43% year over year. The effective tax rate was 8.7%.
Quarterly history
| Quarter | Form | Filed | Revenue | Y/Y | Op. margin | Net earnings | Op. cash flow |
|---|---|---|---|---|---|---|---|
| Q4 FY26 | 8-K | Oct 27, 2026 | $7.1B | +10% | 14.9% | $967M | — |
| Q3 FY26 | 10-Q | Jul 29, 2026 | $6.6B | +9% | 13.9% | $749M | $1.3B |
| Q2 FY26 | 10-Q | May 6, 2026 | $6.1B | +8% | 12.0% | $613M | $672M |
| Q1 FY26 | 10-Q | Feb 4, 2026 | $5.8B | +7% | 11.7% | $524M | $611M |
| Q4 FY25 | 10-K | Nov 14, 2025 | $6.4B | +3% | 28.6% | $1.7B | $968M |
| Q3 FY25 | 10-Q | Aug 6, 2025 | $6.1B | +3% | 14.3% | $701M | $787M |
| Q2 FY25 | 10-Q | May 7, 2025 | $5.7B | +1% | 9.7% | $478M | $550M |
Charts
In supply chains and themes
Interactive views
The same charts as the app — open one to draw it.
💵Where each $1 goesinteractive
Loading the interactive chart…
🌏Named in Asian annual reportsinteractive
Loading the interactive chart…
🔄Rotation against the market and its industry (RRG)interactive
Loading the interactive chart…
🔍Earnings qualityinteractive
Loading the interactive chart…
⚖️Fair value by methodinteractive
Loading the interactive chart…
🔭Outlook & guidanceinteractive
Loading the interactive chart…
📈Investments: gains and what it boughtinteractive
Loading the interactive chart…
🏭Its industry’s money flow (input-output)interactive
Loading the interactive chart…
About Johnson Controls International
Johnson Controls International plc, headquartered in Cork, Ireland, is a global leader in smart, healthy and sustainable buildings, serving a wide range of customers around the globe. The Company’s products, services, systems and solutions advance the safety, comfort and intelligence of spaces to serve people, places and the planet. The Company is committed to helping its customers win and creating greater value for all of its stakeholders through its strategic focus on buildings. Johnson Controls was originally incorporated in the state of Wisconsin in 1885 as Johnson Electric Service Company to manufacture, install and service automatic temperature regulation systems for buildings and was renamed Johnson Controls,
In its own words, from its 10-K, filed Nov 14, 2025.
Johnson Controls International against its Air-Cond & Warm Air Heatg Equip & Comm & Indl Refrig Equip peers
The largest companies of the same SEC industry, each at its latest quarter. Revenue growth: +10% against the peers' median +10%. Operating margin: 14.9% against the peers' median 11.0%.
| Company | Quarter | Revenue | Y/Y | Op. margin |
|---|---|---|---|---|
| JCI Johnson Controls International | Q4 FY26 | $7.1B | +10% | 14.9% |
| CARR Carrier Global | Q3 2026 | $6.3B | +12% | -36.3% |
| LII Lennox International | Q3 2026 | $1.6B | +10% | 19.8% |
| AAON Aaon | Q2 2026 | $627M | +101% | 11.0% |
| TGEN Tecogen | Q2 2026 | $5.7M | -21% | -37.4% |
| EVOH EvoAir Holdings | Q4 FY26 | $107K | -14% | n/m |
Source: Johnson Controls International 8-K on SEC EDGAR · CIK 833444 · Air-Cond & Warm Air Heatg Equip & Comm & Indl Refrig Equip
Guidance and outlook
More on JCI
History
Every quarter: Q4 FY26 results · Q3 FY26 results · Q2 FY26 results · Q1 FY26 results · Q4 FY25 results · Q3 FY25 results · Q2 FY25 results
- Johnson Controls International guidance history: guided vs reported
- Johnson Controls International gross margin by quarter
- Johnson Controls International operating margin by quarter
- Johnson Controls International net income by quarter
- Johnson Controls International free cash flow by quarter
- Johnson Controls International capital expenditures by quarter